
Disclaimer
This is an independent evaluation of the Acas helpline service carried out by BMG Research.
The views in this research paper are the authors' own and do not necessarily reflect those of Acas or the Acas Council. Any errors or inaccuracies are the responsibility of the authors alone.
1. Key findings
1.1 Respondent characteristics
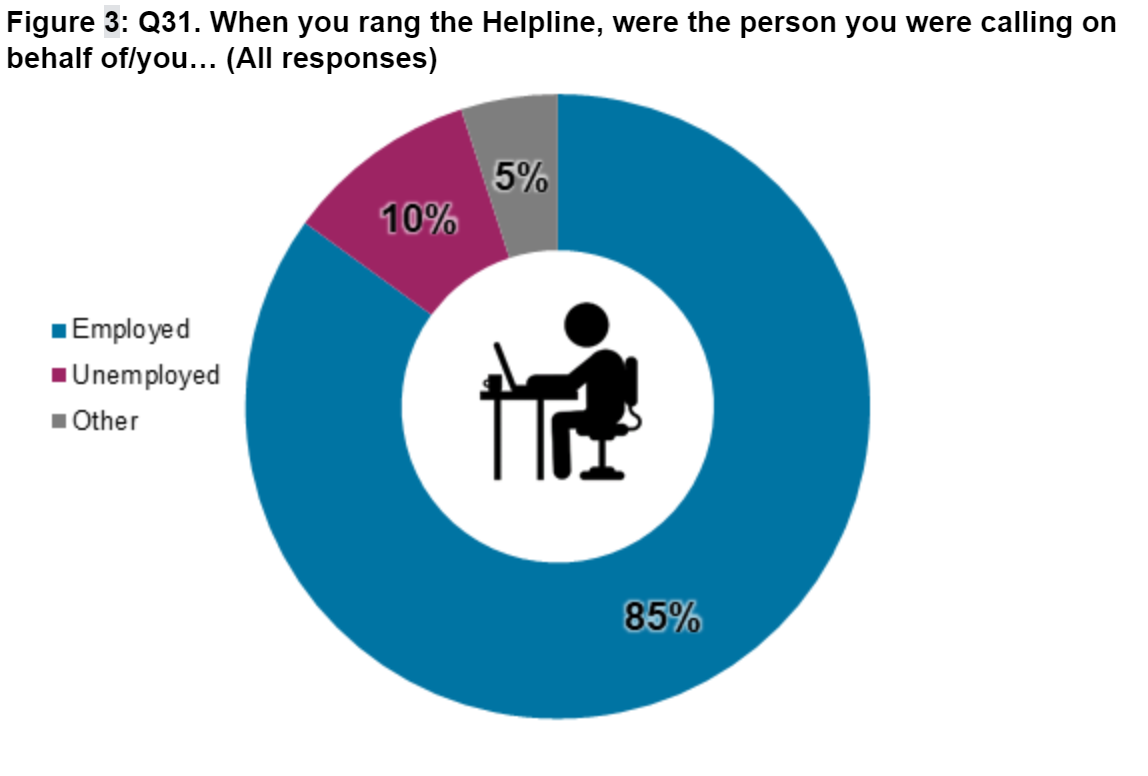
In total, 4,593 respondents completed the Helpline Survey. 11% of these had called the helpline on behalf of a third party.
The majority of respondents had called the Acas helpline as or on behalf of an employee or former employee (84%), while 16% were calling as or on behalf of an employer or manager. This is in line with Acas management information collected at the time of the call by helpline advisers.
The majority of respondents were in full-time employment at the time of making the call (61%) and over half (55%) worked in the private sector. Respondents came from a range of occupations, with no real trend emerging in this regard. Employers or employer representatives were more likely to be in full-time or self-employment, while employees/ former employees/ employee representatives were significantly more likely to be represented in all other employment groups. Employers were also more likely to work in the private or not-for-profit sector, and to work for companies with less than 250 members of staff.
Around 58% of respondents stated their workplace had a HR or personnel department. Just 17% were members of a trade union, decreasing to just 7% for employers or employer representatives. 73% of employers or employer representatives calling the helpline stated they had responsibility for changing or updating workplace policies.
There was a relatively even gender split between respondents; male (49%) and female (44%). However, this is less balanced for employers or employer representatives, with 63% of this subgroup being female. The mean age of respondents was 44.6 years, and three-quarters (75%) identified as white British. Around a quarter of respondents (24%) identified as having a long-term health problem, illness, or a disability.
1.2 Reason for call
When respondents were asked to state the main subject of their call, the most common was regarding discipline, dismissal or grievance (27%). This was the most common subject for both employees (29%) and employers (21%). Other common subjects covered were redundancy or lay-offs (15%), contracts (13%) and wages (11%).
Employers or employer representatives were particularly likely to be calling about contracts (16%) and absence, sickness and stress (14%), while employees, former employees or employee representatives were more likely to be calling about redundancy, lay-offs and business transfers (16%) and wages (12%).
When considering their stage in the dispute resolution process, those in the information request and informal action stages were more likely to be calling about absence, sickness and stress; holidays and working time; and maternity, paternity and adoption. Those in the more formal stages were more likely to be calling about diversity and discrimination, wages, and discipline, dismissal and grievance.
1.3 Journey to the helpline service
26% of respondents found out about the helpline through a friend or family member. 21% found out through the Acas website or through a general internet search (15%). Employers were significantly more likely to have heard about the helpline through the Acas website when compared to employees – 33% compared with 19%.
The average number of calls made to the helpline by respondents in the past 12 months was 2.3. Employers made a significantly higher number of calls when compared to employees, as did those calling about employment tribunals, diversity and discrimination, or discipline, dismissal or grievances.
The majority of respondents tried to resolve their query in another way prior to calling the helpline; 54% had visited the Acas website, 36% had discussed their problem with a manager, and 30% had sought assistance from another body. Employers and managers were significantly more likely to have visited the website than employees, particularly those in less stable forms of employment such as zero-hours and temporary workers.
The most common reasons for not visiting the Acas website prior to calling the helpline were that respondents would prefer to speak to an adviser (40%), and their query being too specific for general information (36%). Of those who had visited the Acas website prior to calling the helpline, the most common reason for calling the helpline subsequently was that the website had only partially answered their query (54%).
Over half of those who had not visited the Acas website stated that they would be more likely to use it if it offered easy-to-understand written articles (53%) or a webchat function (52%). 47% agreed that videos of advisers explaining issues would make them more likely to use the Acas website.
1.4 Accessing the helpline
The majority of respondents (85%) made just one call attempt before getting through to an adviser, with the mean number of calls being 1.4. The most common wait time for the call to be answered was between 1 and 3 minutes (33%) with just 1% stating that they had waited for more than 20 minutes.
Encouragingly, 90% of respondents were at least somewhat satisfied with their call-wait time. As would be expected, this satisfaction declines as call-wait times become longer, with 69% of those waiting between 5 and 10 minutes being satisfied. Those who made more than 1 call attempt were also significantly less likely to be satisfied with call-wait times.
1.5 Call outcomes
87% of respondents took some form of action as a result of their call to the helpline, comparing favourably to the 70% target as set by one of Acas’s KPIs. The most common actions were to discuss the problem with their employer or HR (41%), seeking assistance from another body (20%) and making a formal complaint (19%). Just 12% of respondents called the helpline again to follow up on their initial enquiry.
Of those who sought assistance from another body, 2 in 5 (42%) did so on the recommendation of their helpline adviser. A similar proportion (41%) had always planned to use other sources of information in addition to Acas – the most common being a lawyer or solicitor (47%). 29% of employees sought advice from their Trade Union representative. Concerning workplace policies, around a quarter of employers or managers (24%) have implemented or updated them as a result of their call to the helpline, with a further 28% intending to do so.
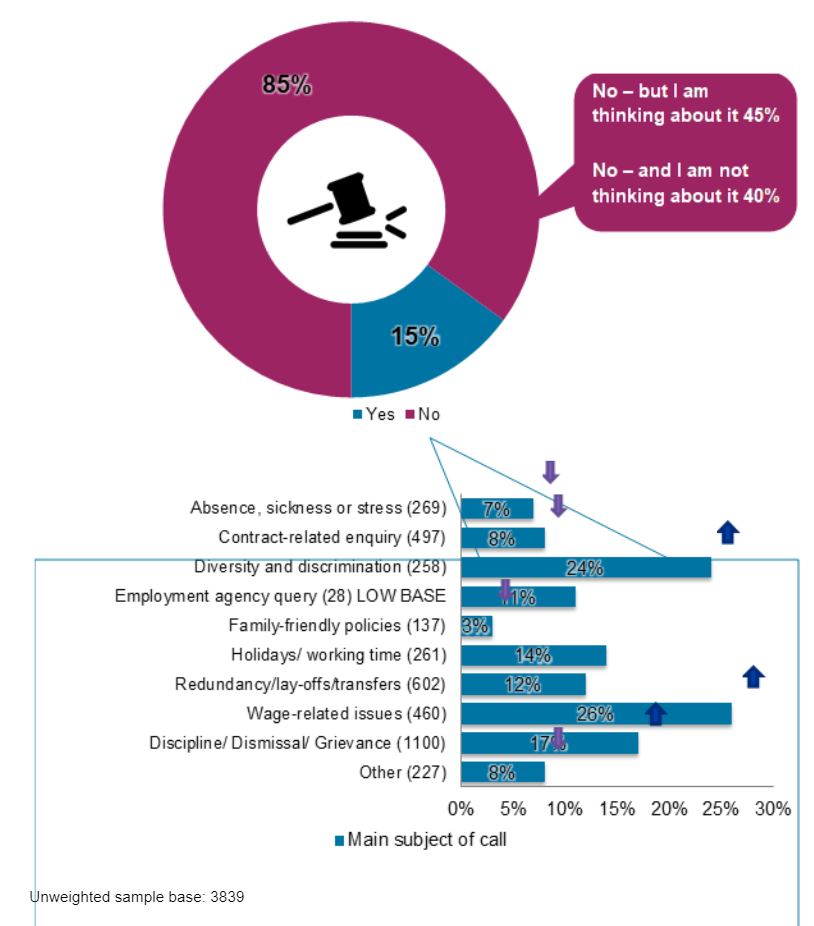
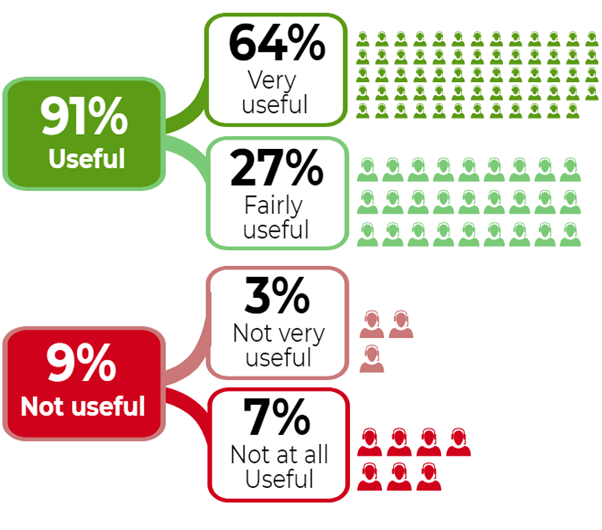
43% of employees were considering making a claim to an employment tribunal prior to their call. Following their call, 15% stated that they had made a claim, with a further 45% stating that they were thinking about doing so. 87% of employees stated that their call to the Acas helpline was important in their decision to submit a tribunal claim. Conversely, 14% of employers called the helpline with concerns about an employee making a claim. 9 in 10 (91%) employers found their call to the helpline useful in dealing with a possible tribunal situation, with almost two thirds (64%) finding it very useful.
1.6 Satisfaction with helpline service
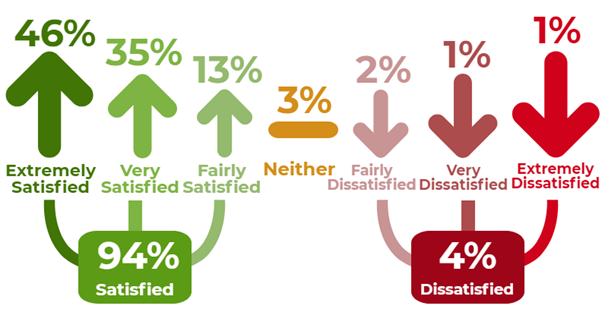
Over 9 in 10 respondents (94%) are satisfied with the service they received from Acas; with 46% extremely satisfied. This decreases significantly as the number of call attempts and the time taken for calls to be answered increases.
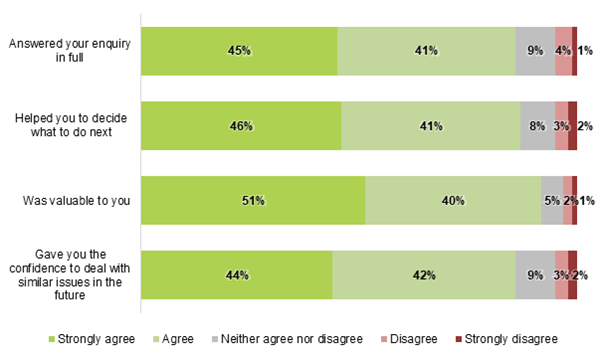
Perceptions of the information provided by Acas are positive, with the majority of respondents agreeing that their enquiry was answered in full (86%), the information helped them decide what to do next (88%), it was valuable to them (91%) and it gave them confidence to deal with similar issues in the future (86%).
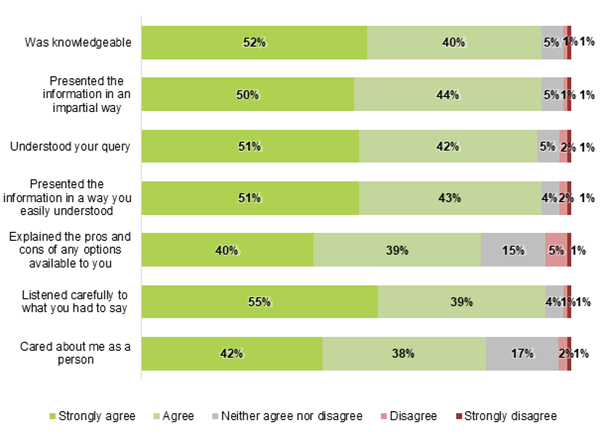
Perceptions of the Acas adviser were also overwhelmingly positive; the exceptions being, though still yielding positive results, that staff explained the pros and cons of the options available (79%) and that staff cared about them as a person (80%).
The majority of respondents (94%) thought their call duration was ‘about right’. Employers were more likely than employees to feel this way (97% compared with 94%). The Acas helpline yielded a net promoter score (NPS) of +70. This can be considered a very positive result, and is a strong indication that users are likely to recommend and speak positively of the Acas helpline based on the experience they had.
1 in 5 respondents felt they went to a great degree of effort to get their query answered by Acas. The proportion of respondents feeling they went to ‘much effort’ to get their query answered increases significantly as the levels of overall dissatisfaction heighten. 2 in 5 respondents feel that the Acas adviser in turn, went to the maximum amount of effort to answer their query.
2. Introduction
2.1 Background and objectives
The Advisory, Conciliation and Arbitration Service (Acas) helpline provides practical guidance for employers, employees and their representatives covering a range of employment issues, including resolving problems at work, understanding employment rights, and improving employee relations. Approximately 800,000 calls are handled by the helpline each year.
The purpose of this survey is to evaluate the quality and effectiveness of the helpline service, to ensure that this service continues to meet the needs of Acas’s customers.
This project takes place in the context of some key changes to the Acas helpline. Helpline operations have been merged from 11 regional centres to 4. More broadly, helpline usage is declining and the user population is changing: while there has historically been a 50:50 employer:employee split between helpline users, this has recently shifted to around 20:80.
2.2 Methodology
The fieldwork for this survey was undertaken between June 2018 and June 2019, using a continuous online (CAWI) approach supplemented by a single wave of telephone interviews. For the online element, helpline advisers asked 1 in 15 callers throughout the study period to participate in the survey, collecting the email addresses of those who agreed. These email contacts were uploaded by Acas to a secure shared folder on a weekly basis.
BMG then sent out email invitations to all of the shared contacts, containing a unique link to participate in the online survey. These were followed by 2 email reminders to non-respondents 5 days and 9 days after the initial contact.
Telephone interviews took place during February 2019. Recruitment occurred throughout January 2019; with an increased number of helpline users asked by helpline advisers to participate in the study, collecting the telephone numbers of those who agreed. Those who did not wish to share their telephone number were provided with the opportunity to participate in the online study.
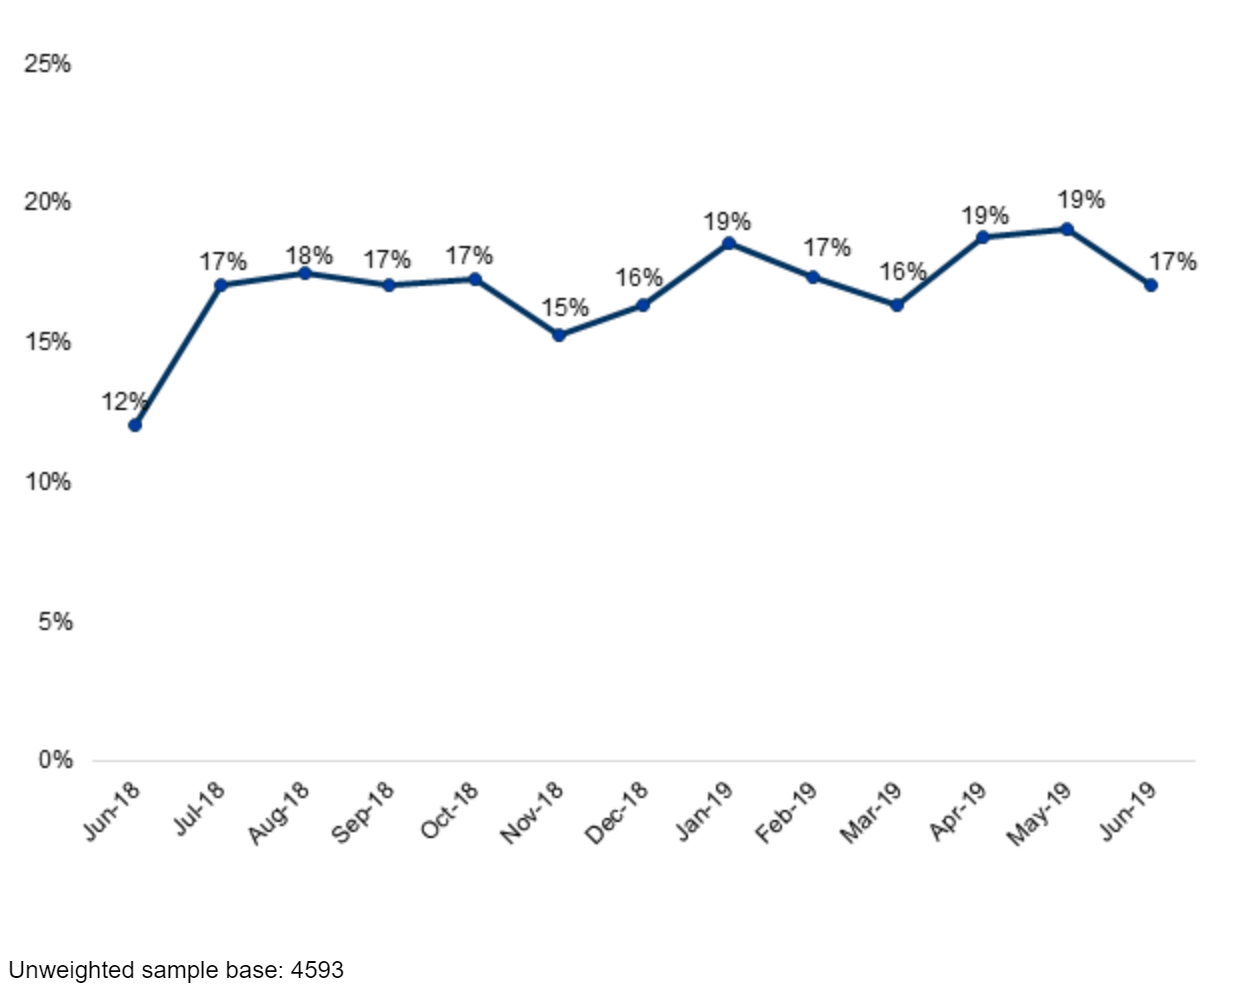
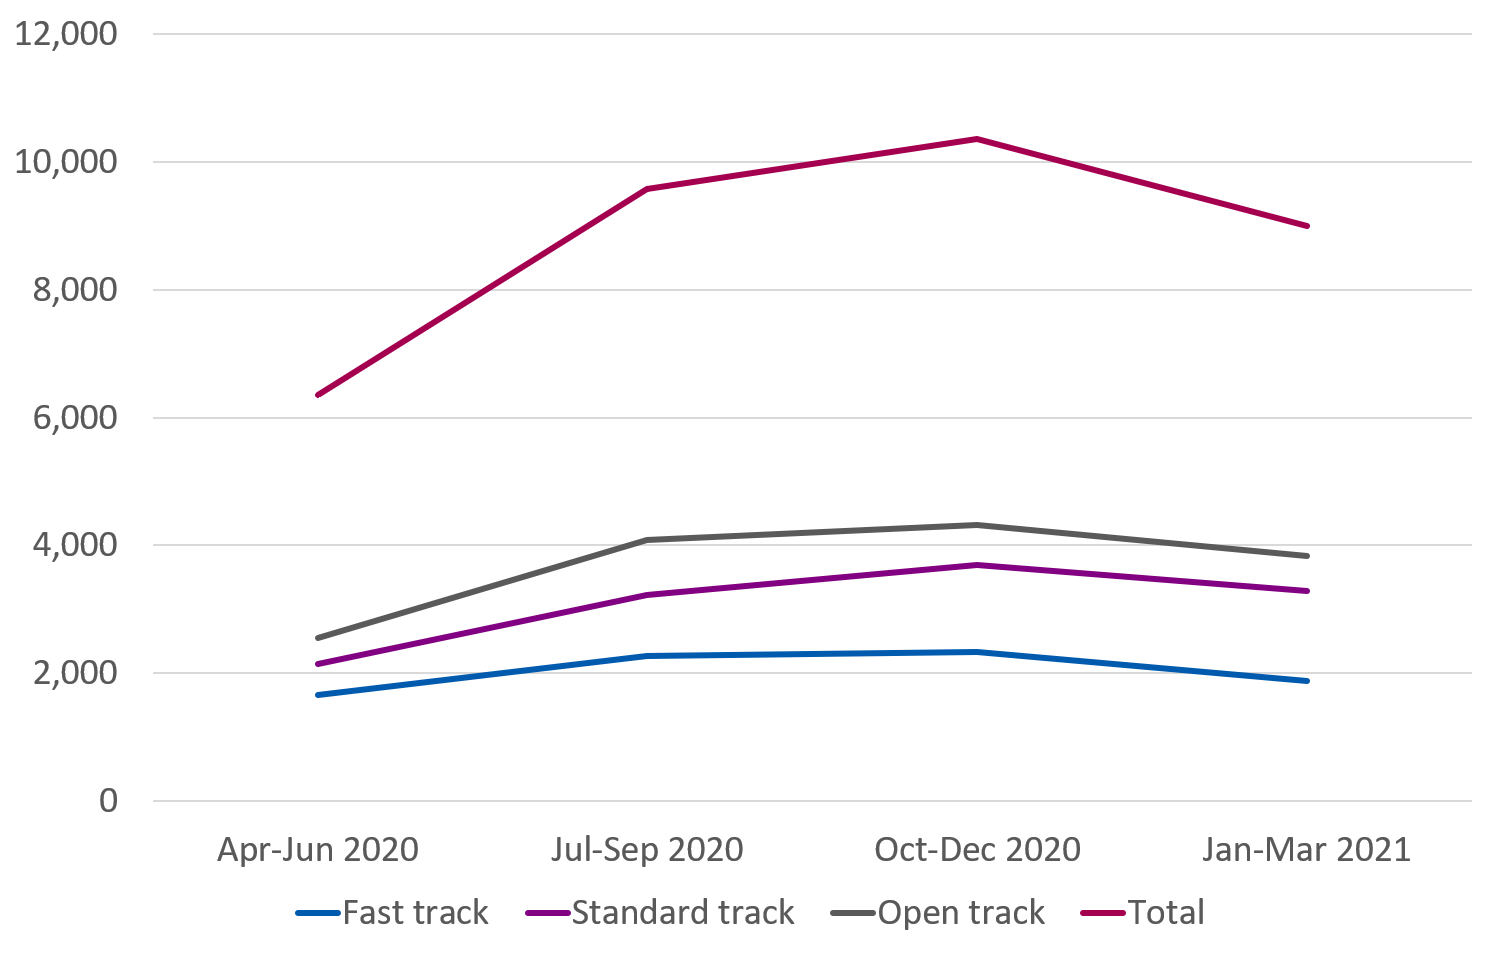
In total, 4,593 surveys were completed; 4,115 online and 478 by telephone. The total response rate ranged between 12% and 19% for each month of the study, as shown in the chart below.
The table below shows the time lag between respondents making their call to the helpline and them completing the survey. There is a higher time lag for respondents completing the survey by telephone. This is because all telephone interviews were conducted during February 2019, with respondents who had called the helpline in the previous month, whereas CAWI fieldwork was running continuously.
| Online (4,115) | Telephone (478) | |
|---|---|---|
| Total (4,593) | 90% | 10% |
| 0-5 days (732) | 100% | 0% |
| 6-10 days (1517) | 100% | 0% |
| 11-15 days (1333) | 99% | 1% |
| 16-20 days (501) | 96% | 4% |
| 21- 25 days (102) | 62% | 38% |
| 26-30 days (168) | 5% | 95% |
| 31-35 days (138) | 1% | 99% |
| Over 35 days (102) | 0% | 100% |
2.2.1 Rounding
Figures and tables are used throughout the report to assist explanation and analysis. Although occasional anomalies appear due to rounding differences, these are never more than +/-1%. These occur where, for example, the proportion of respondents who are very satisfied and fairly satisfied are added to produce an overall satisfaction figure.
For example, if 25.4% of respondents state they are very satisfied and 30.3% of respondents are fairly satisfied, these figures are rounded down to 25% and 30% respectively. However, the sum of these 2 responses is 55.7% which is rounded up to 56%, whereas the individual scores suggest this total should be 55%.
2.2.2 Significance testing
Throughout this report, the term ‘significant’ is only used to describe differences within particular groups (for example age, employment status) that are statistically significant. If a subgroup has an unweighted base of less than 30, these results should be taken as indicative only.
3. Respondent characteristics
In total, 4,593 people responded to the helpline survey. The following section breaks down the key characteristics of these respondents according to employment status and other demographics.
Some respondents were calling the Acas helpline on behalf of a third party (11% in total). These respondents were asked about the characteristics of the person for whom they were calling on behalf. For brevity, the term ‘respondent’ used in this section also includes third parties for whom the call was being made on behalf.
3.1 Type of caller
Respondents were asked whether they were calling as or on behalf of an employee or former employee, or an employer or manager. Overall, 84% of respondents were calling as or on behalf of employees or former employees, while 16% were calling as or on behalf of employers or managers. This is in line with Acas management information collected at the time of the call by helpline advisers.
3.1.1 Employment status
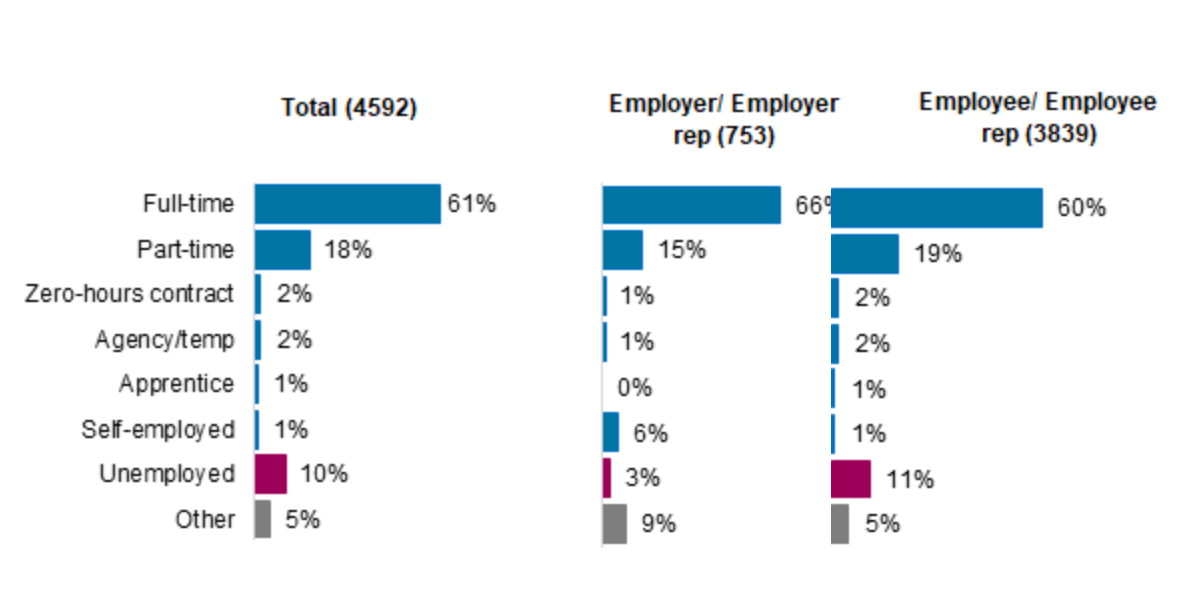
Respondents were asked to disclose their employment status or the employment status of the person for whom they were calling on behalf. More than 6 in 10 respondents (61%) were in full-time employment at the time of making the call, with a further 18% in part-time employment. Just 10% were unemployed, and only between 1% and 2% were agency workers, temporary workers, zero-hours workers, or apprentices.
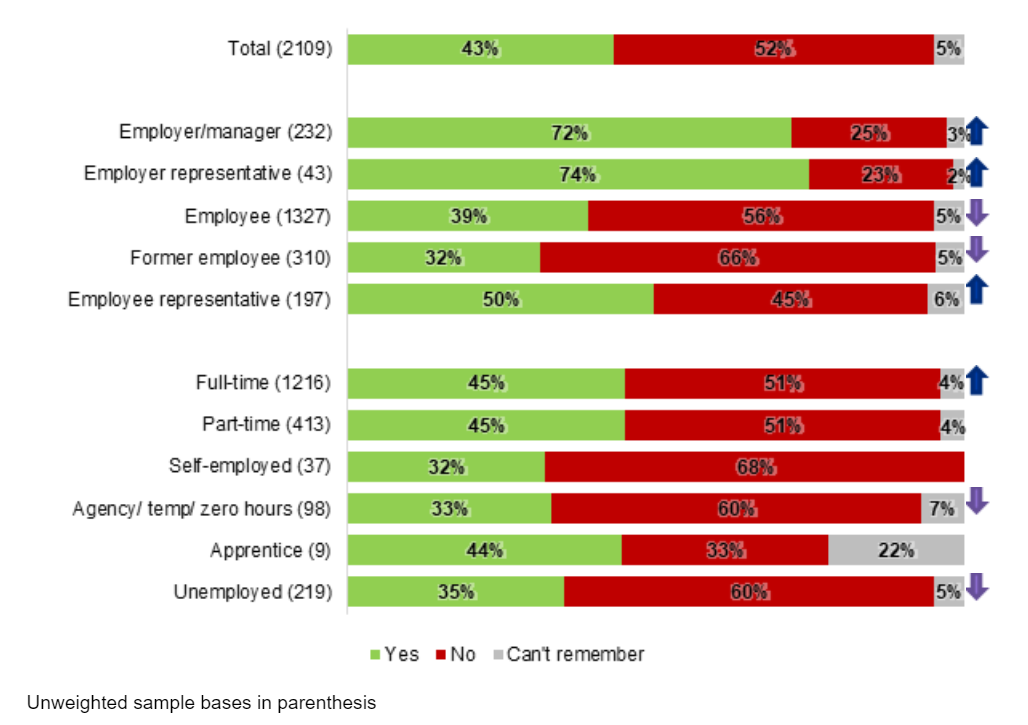
The figure below shows employment status of the total sample and split out according to whether the caller was an employer/ employer representative, or employee/ former employee /employee representative.
Employers and their representatives were significantly more likely to be employed full-time when compared to employees / former employees and their representatives (66% compared with 59%). Employers and their representatives were also more likely to be self-employed (6%, compared with 1% of employees and their representatives), while employees were more likely to be represented in all other groups.
Unweighted sample bases in parenthesis
3.2 Place of work
Over half of the respondents (of those employed or self-employed) stated that they worked in the private sector (55%), with 28% working in the public sector and 7% in the non-for-profit or voluntary sector. Employers and their representatives were significantly more likely to work in the private sector (68%, compared with 53% of employees or former employees or employee representatives) and the voluntary or non-profit sector (13%, compared with 6% employees or former employees/ employee representatives). Conversely, employees/ former employees/ employee representatives were significantly more likely to work in the public sector (31% compared with 16% of employers/ employer representatives).
Regarding the size of the respondents’ workplace, the highest proportion of respondents worked for small organisations with fewer than 50 employees (37%). The next most popular response was 50-249 employees (18%). Interestingly, employers and their representatives were significantly more likely to work for smaller businesses, while employees/ former employees/ employee representatives were significantly more likely to work for companies with 500 or more staff. This is signified by the blue arrows in the chart below.
Respondents were asked about the principle activity of the organisation they worked for. They were then attributed a Standard Industrial Classification (SIC) code according to the answers given. Descriptions of these codes, alongside the percentage of respondents falling into each occupational grouping, are shown in the table below. Categories where less than 1% of respondents were allocated have been excluded.
Where there is a statistically significant difference between employers/ employer representatives and employee/ former employee/ employee representatives, this is shown by a blue arrow.
| Code | Description | Employer/employer rep (665) | Employee/former employee/employee rep (3,232) |
|---|---|---|---|
| C | Manufacturing | 10% | 9% |
| E | Water supply; sewerage, waste management and remediation activities | 1% | 1% |
| F | Construction | 8% | 5% |
| G | Wholesale and retail trade; repair of motor vehicles and motorcycles | 12% | 14% |
| H | Transport and storage | 4% | 6% |
| I | Accommodation and food service activities | 5% | 7% |
| J | Information and communication | 5% | 3% |
| K | Financial and insurance activities | 1% | 3% |
| L | Real estate activities | 2% | 2% |
| M | Professional, scientific and technical activities | 7% | 4% |
| N | Administrative and support service activities | 9% | 7% |
| O | Public administration and defence; compulsory social security | 2% | 4% |
| P | Education | 6% | 6% |
| Q | Human health and social work activities | 17% | 20% |
| R | Arts, entertainment and recreation | 2% | 2% |
| S | Other service activities | 3% | 2% |
3.1.2 Human resources department and trade union membership
When asked whether their workplace had a HR or personnel department, 58% answered in the affirmative, while around a third (34%) stated that it did not. Employees/ former employees/ employee representatives were significantly more likely to state that their workplace had a HR department when compared to employers/ employer representatives (59% compared with 51%).
Those who stated they were employed or self employed were also asked if they were a member of a trade union. In total, just 17% answered in the affirmative, with 83% stating that they did not belong to a trade union. Employees/ former employees/ employee representatives were significantly more likely to be trade union members (19%, compared with 7% of employers/ employer representatives).
When asked whether they had any responsibility for introducing or changing policies and/or procedures in their workplace, 73% employers/ employer representatives answered in the affirmative, while a quarter (25%) stated that they did not. A ‘don’t know’ option was available for this question, which was coded by 1% of respondents. All of these were external representatives for employers.
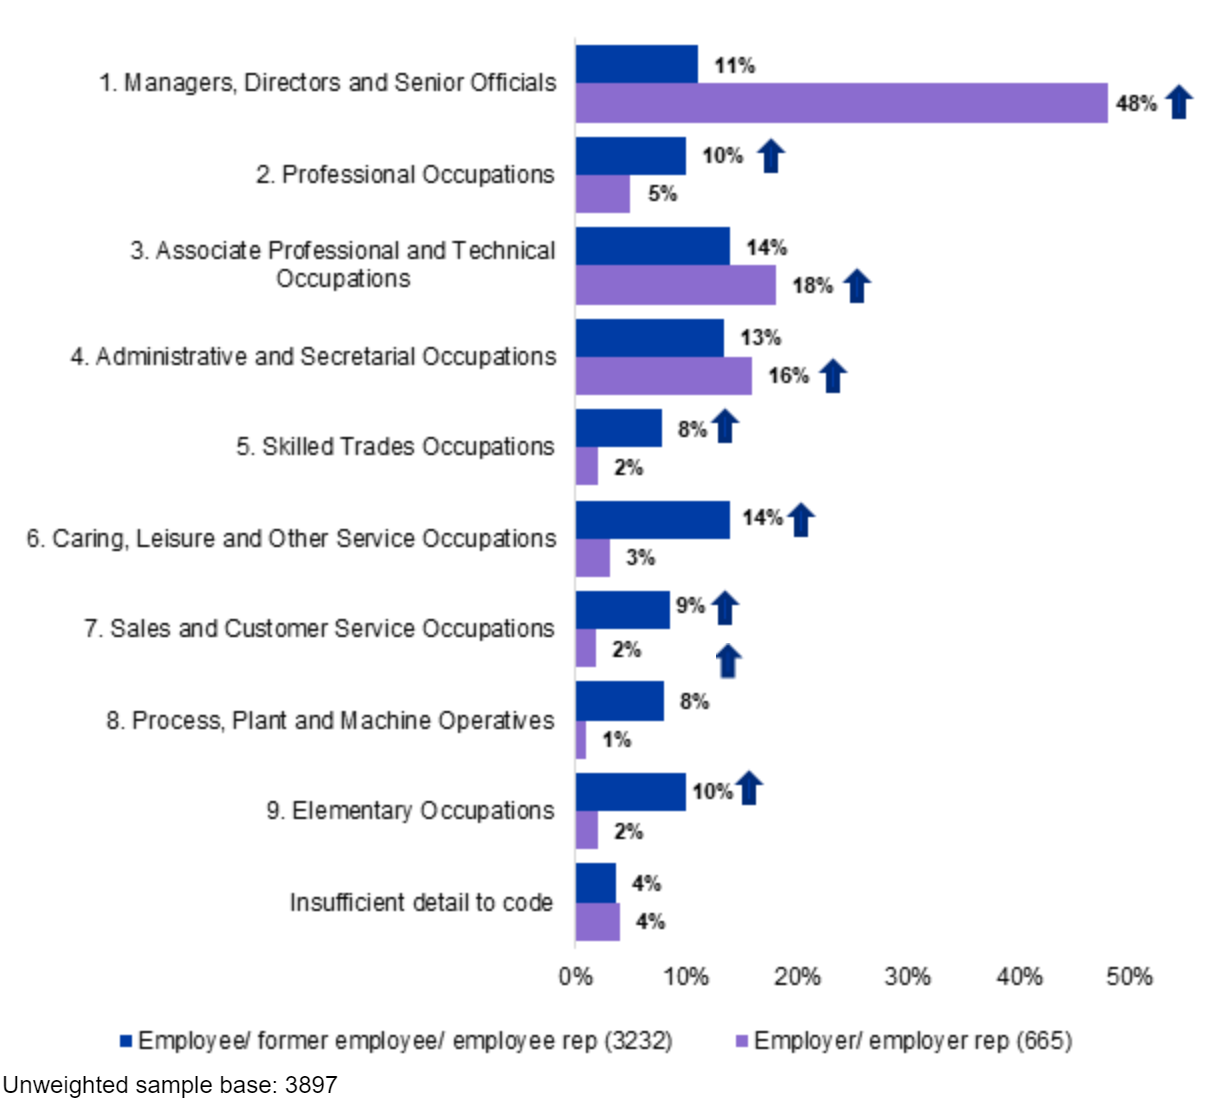
3.2 Job role
Respondents were asked to describe their job title, and were then attributed a Standard Occupational Classification (SOC) accordingly. The results of these groupings are shown in the chart below.
Unsurprisingly, employers/ employer representatives were significantly more likely to fall into the managers, directors and senior officials category (48%, compared with 11% of employees/ former employees/ employee representatives). They were also significantly more likely to be represented in the associate professional and technical occupations (18% compared with 14%) and administrative and secretarial occupations (16% compared with 13%) categories when compared to employees/ former employees/ employee representatives.
Employees/ former employees/ employee representatives were significantly more likely to be represented in most other categories. These differences are highlighted by the blue arrows in the chart below.
3.3 Demographics
3.3.1 Gender
In order to ensure Acas's services are meeting the needs of all sections of the population, respondents were asked to answer some questions relating to their gender, age, ethnicity, and health/ disability status. Respondents were made aware that they were free not to answer these questions.
There was a relatively even gender split amongst respondents, with 49% identifying as male and 44% as female. ‘Other’ and ‘rather not say’ options were also available for this question, which were coded by 4% and 3% of respondents respectively. The majority of employers for whom the call was made on behalf were female (63%), while the majority of employees/ former employees for whom the call was made on behalf of were male (53%).
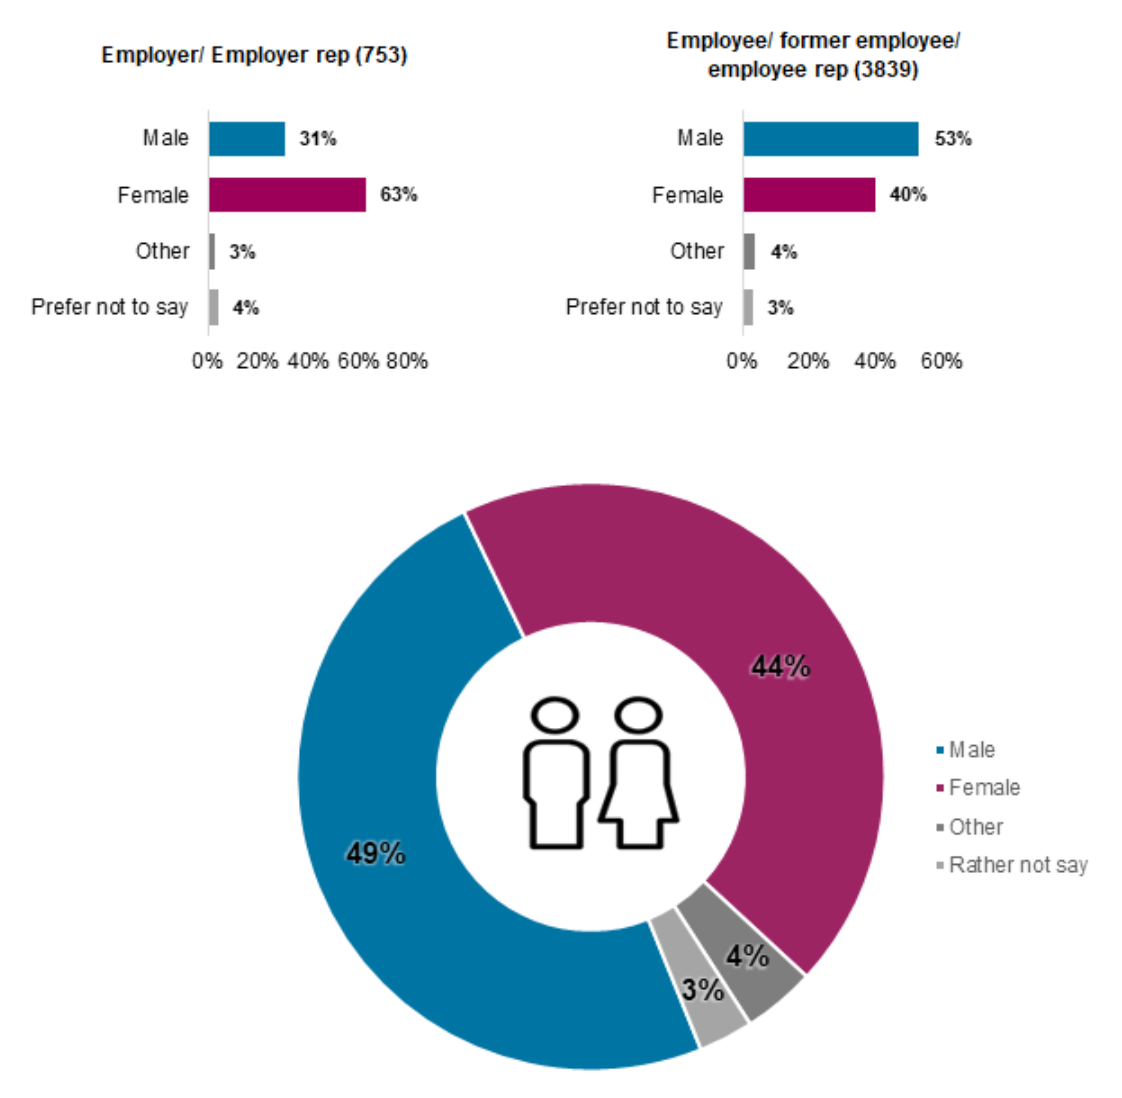
Unweighted sample base: 4,592
3.3.2 Age
The age group of the callers/ those for whom the call was made on behalf of is shown in the chart below. As might be expected, there are few respondents in the age 65+ category (3%), with most being represented in the middle-age groups. The mean age of the respondents was 44.6 years. An option for respondents aged 16-17 was included, but less than 1% of respondents fell into this category.
Employers/ employer representatives were significantly more likely to state that they would prefer not to disclose their age; 23%, compared to a 12% total average and 10% of employees/ former employees/ employee representatives. Additionally, they were significantly less likely to fall into the 18-24 (2%), 25-34 (13%) and 55-64 (14%) age categories. A similar proportion of employees and employers are categorised into the 35-44, 45-54 and 65+ groups.
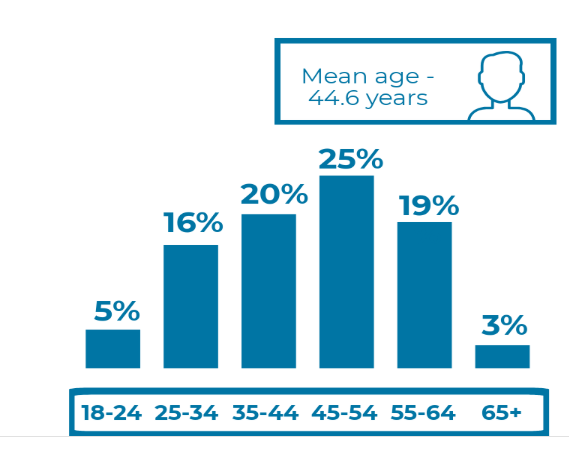
Unweighted sample base: 4,593
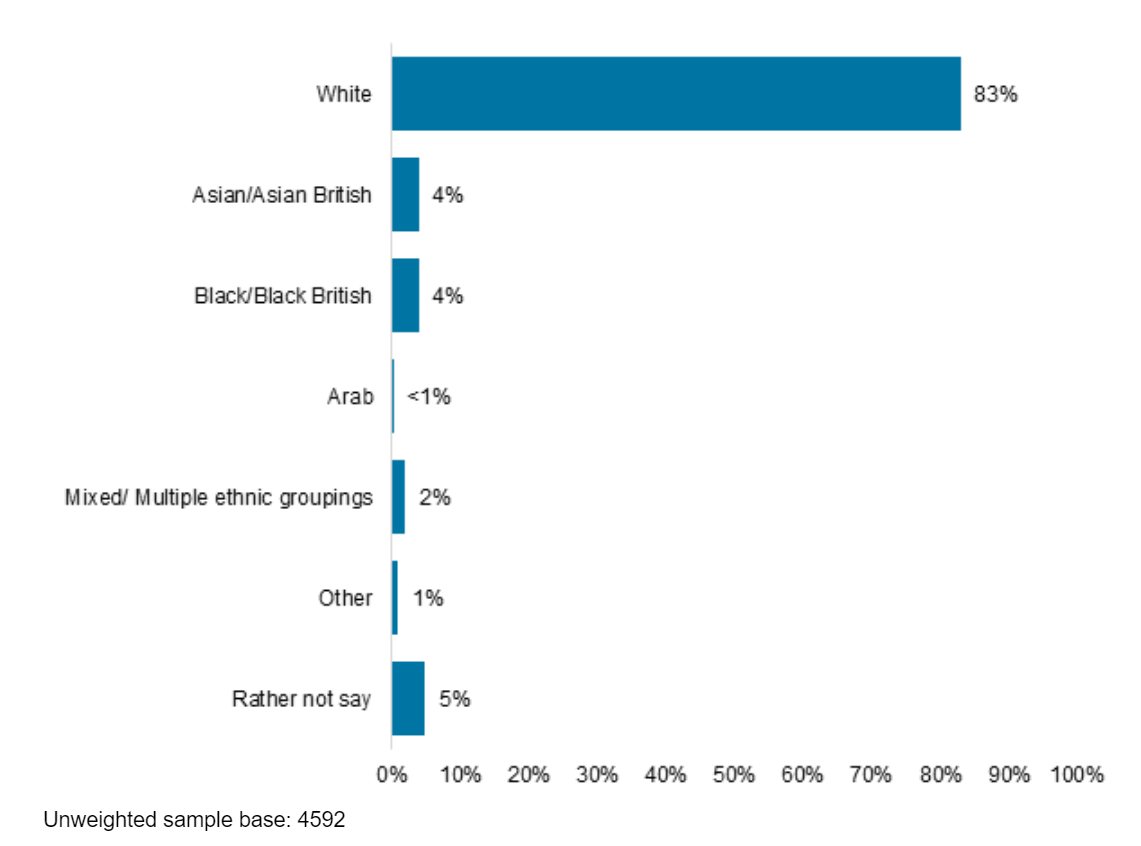
3.3.3 Ethnicity
The majority of callers identified as white (83%), with 75% identifying as white British. 4% identified as Asian/ Asian British, and 4% identified as black/ black British. There are few differences between employer and employee groups with regards to ethnicity, although it is interesting to note that employers/ employer representatives were more likely to state they would prefer not to disclose their ethnicity (9%, compared with 4% of employee/ former employees/ employee representatives).
Respondents were also asked whether they spoke English as their first or main language. 91% answered in the affirmative for this question, with 7% stating they did not, and 2% stated they'd rather not say. Employees/ former employees/ employee representatives were more likely to state that they did not speak English as their first language when compared to employers/ employer representatives 7% compared with 4%, while employers were more likely to state that they would rather not say (4% compared with 2%).
3.3.4 Disability or long-standing health issues
The final demographic question asked respondents whether they/ those they were calling on behalf of considered themselves to have a long-term health problem, illness, or disability. 7 in 10 respondents stated they did not have a longstanding illness or disability, while 24% stated that they did. 5% of respondents selected the ‘rather not say’ option for this question.
Employees, former employees or employee representatives were significantly more likely to state that they had a disability or long-standing health issue when compared to employer representatives (27% compared with 11%). Employers and their representatives were once again more likely to state that they would rather not say for this question (8%, compared with 5% of employees, former employees or employee representatives).
4. Reason for call
4.1 Subject of query
4.1.1 Subject of call
Respondents were asked to select from a list of options which topics were covered by their query. They were able to select multiple options. These options were as follows:
Table 3: Reason for call and examples
Absence, sickness and stress:
- absence
- sick pay
- stress
Contracts:
- terms and conditions
- notice period or pay
- probation period
- rights of casual or temporary or fixed-term workers
- variation
- agency worker regulations
- zero-hour contracts
Diversity and discrimination related to:
- age
- disability
- gender reassignment
- race
- religion
- sex
- sexual orientation
Employment agencies:
- contracts/ terms
- non-receipt of contract
- advertising jobs overseas
- contract conditional on buying goods/ services
- entertainment/ model agencies
Family friendly policies:
- flexible working regulations
- rights of part-time workers
- time-off for dependants
Holidays and working time:
- holiday entitlement
- Working Time Regulations
- bank/ public holidays
Maternity, paternity and adoption:
- maternity rights
- paternity rights
- parental leave
- leave relating to adoption
Redundancy, lay-offs and business transfers:
- redundancy or redundancy pay
- lay-offs or short-time work
- company take-over or merger
Wages, including National Minimum/Living Wage:
- non-payment or deduction of wage
- National Minimum or Living Wage
- other wage issues
Discipline, dismissal and grievance:
- discipline procedure
- dismissal
- grievance procedure
- bullying or harassment
- constructive dismissal
Others:
- references
- retirement
- physical mistreatment
- modern slavery
- anything else
4.1.2 Main subject of query
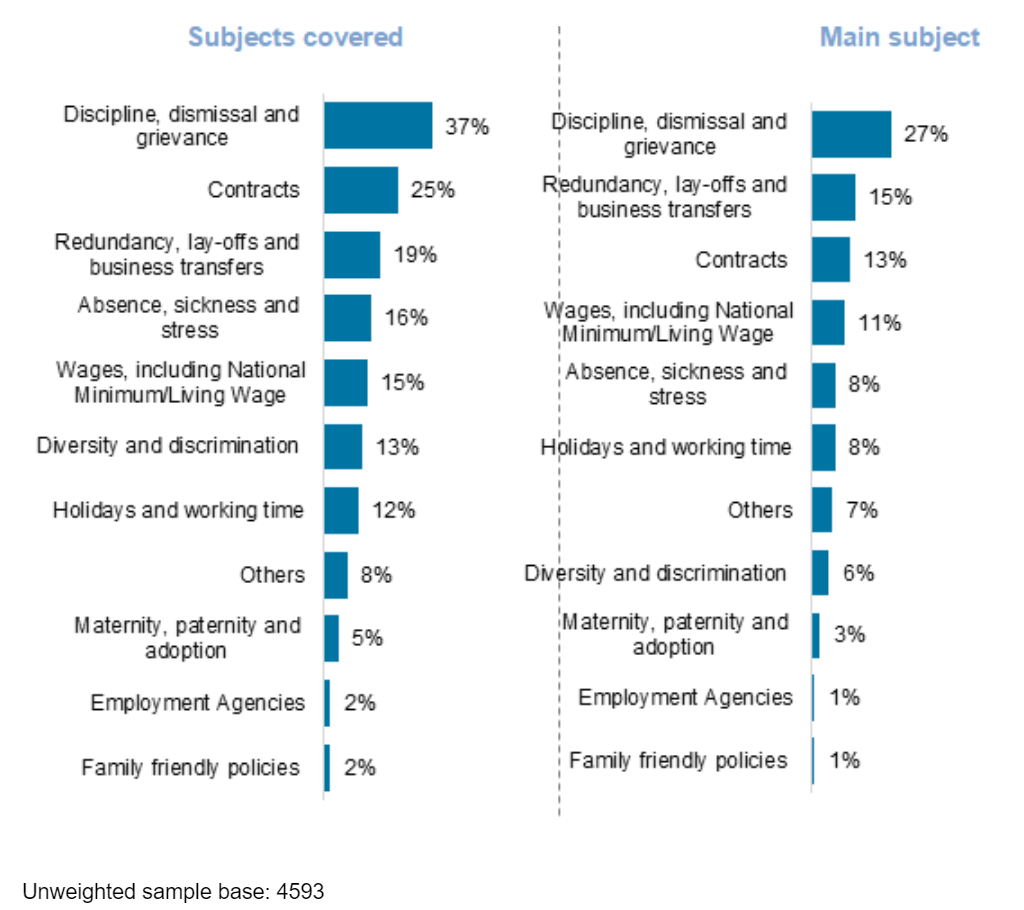
Overall, the most common topic covered was discipline, dismissal and grievance, which was cited by 37% of respondents. This was followed by contracts, cited by 25% of respondents, and redundancy, layoffs and business transfers, cited by 19% of respondents. 8% of respondents selected ‘other’ for this question. When asked to specify further, a range of answers were given, including but not limited to disability and mental health, sexual harassment, whistleblowing, references, bullying, and Transfers of Undertakings (TUPE).
Next, respondents were asked to indicate the main subject covered by their query. Here, discipline, dismissal and grievance was the most common subject, selected by 27% of respondents overall. 15% of respondents selected redundancy, lay-offs and business transfers as the main topic of their enquiry, while 13% selected contracts.
Q6 From the list of subjects below, please indicate which were covered by your query
Q7 Please indicate which was the main subject covered by your query
(all responses)
4.1.3 Main subject – by employers or employees
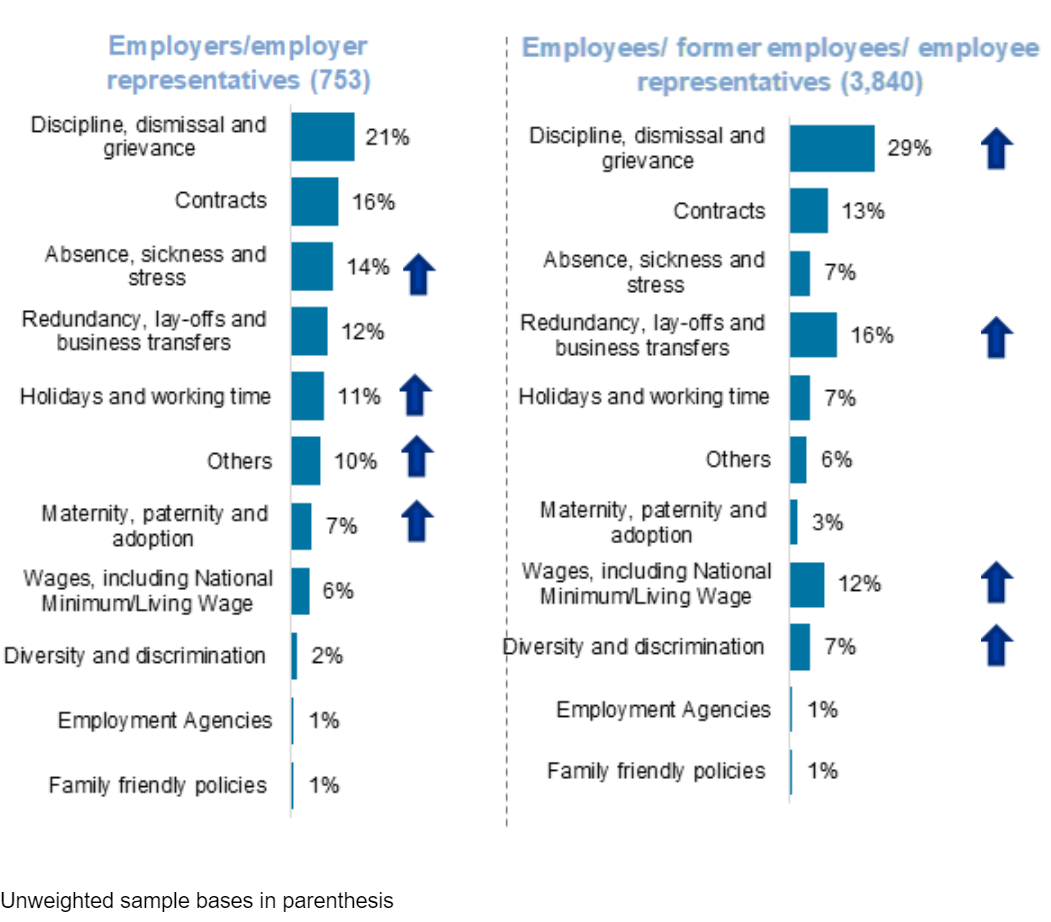
As expressed in the chart below, employers were more likely than employees to be calling about absence, sickness or stress as the main topic of their enquiry – 14%, compared with 7% of employees/ former employees/ employee representatives. They were also more likely to be calling about holidays and working time (11% compared with 7% of employees) and maternity, paternity and adoption (7% compared with 3% of employees).
Employees, on the other hand, were more likely to be calling about diversity and discrimination (7% compared with 2% of employers); discipline, dismissal and grievance (29% compared with 21%); redundancy, lay-offs and business transfers (16% compared with 12%) and wages (12% compared with 6%).
Within the employee category, former employees were most likely to be calling about wages (21%) and discipline, dismissal and grievance (36%). Agency, temporary and zero-hours workers were also significantly more likely to cite wage-related issues as the main subject of their enquiry (27%).
The chart below shows the main subject of the respondents’ call separated by employer and employee subgroups. Where the proportion is significantly higher for one group than for the other, this is highlighted by a blue arrow.
4.1.4 Main subject – by industry and occupation
There were also a number of differences in the main topic of the call according to the industry and occupation of the respondent. The industry and occupation the respondent works in has been coded into the Standard Industrial Classification (SIC2007) and Standard Occupational Classification (SOC2010) based on how the respondent described their job and the organisation that they worked for.
4.1.4.1 Industry of respondent
For employers or employer representatives
Those working in manufacturing were significantly more likely to be calling about absence, sickness and stress when compared to the total average (15% compared with 8%), as were those working in wholesale and retail trade or vehicles repairs (14%).
Those working in information and communications were significantly more likely to be calling about maternity, paternity and adoption (13% compared with 3% total average), as were those working in professional, scientific and technical activities (13%), administrative and support services (12%), education (11%), and health and social work (7%).
For employees/ former employees/ employee representatives
Those working in transport and storage were significantly more likely to be calling about wages when compared to the total average (16% compared with 11%), as were those working in administrative and support services (20%) and construction (18%).
Those working in the accommodation and food service sector were also significantly more likely to be calling about wages (17% compared with 11%). Additionally, they were significantly more likely to be calling about holidays and working time (13% compared with 8%), as were those working in administrative and support services (11% compared with 8%).
Those working in information and communication were more likely to be calling about diversity and discrimination (12% compared with 6%) and redundancy, lay-offs and business transfers (30% compared with 15%).
Those working in the financial and insurance industries were significantly more likely to be calling about absence, sickness and stress (17% compared with 8%).
Those working in real estate were significantly more likely to be calling about redundancy, layoffs and business transfers (35% compared with 15%), as were those working in professional, scientific and technical activities (23%) and manufacturing (24%).
Respondents working in public administration and defence were significantly more likely than total average to be calling about diversity and discrimination (14% compared with 6%).
Those working in health and social work were more likely to be calling about contracts (17% compared with 13%).
4.1.4.2 Occupation of respondent
For employers or employer representatives
Managers, directors and senior officials were significantly more likely to be calling about absence, sickness and stress when compared to the total average (16% compared with 8%). They were also significantly more likely than average to be calling about maternity, paternity and adoption (7% compared with 3%), as were those working in associate professional and technical occupations (10% compared with 3%).
Those in professional occupations were significantly more likely than the total average to be calling about family-friendly policies (6% compared with 1%).
Those in administrative and secretarial occupations were significantly more likely to be calling about absence, sickness and stress (17% compared with 8%), holidays and working time (19% compared with 8%) and maternity, paternity and adoption (8% compared with 3%).
For employees/ former employees/ employee representatives
Managers, directors and senior officials were more likely to be calling about redundancy, lay-offs and business transfers (20% compared with 15%) and discipline, dismissal and grievance (34% compared with 27%).
Those in professional occupations were more likely to be calling about contracts (17% compared with 13%) and diversity and discrimination (9% compared with 6%).
Those in associate professional and technical occupations were also significantly more likely to be calling about redundancy, lay-offs and business transfers (22% compared with 15%), as well as diversity and discrimination (10% compared with 6%).
Those in skilled trade occupations were more likely to be calling about wages (15% compared with 11%), as were those in caring, leisure and other service occupations (16%) and elementary occupations (17%).
Process, plant and machine operatives and those in elementary occupations were both significantly more likely than the total average to be calling about holidays and working time – 14% and 13% respectively, compared with an 8% total average.
4.1.5 Main subject – by dispute resolution stage
During the call, the helpline adviser captures some additional information about the nature of the call. This includes categorising the call according to the 'dispute resolution stage' they assess the caller to be at depending on the information provided by the caller.
The helpline adviser categorises the calls as follows:
- information request – the call is a request for information only, there is no dispute between employee and employer
- informal action – there is a dispute between the employee and employer but they have yet to speak to each other; need to try and resolve by the employee/employer speaking to each other in the first instance
- formal action – the start of a formal procedure on something for example a disciplinary or grievance process
- employment tribunal – internal workplace procedures have been exhausted or the caller insists that they're not going to follow internal process and wants to start a claim/proceed to early conciliation
- enforcement complaints – where there is a referral to an enforcement body
- not clear – anything that doesn't fit into the above categories, or where the helpline adviser does not have enough information to categorise the call
The table below shows the main subject of enquiries according to dispute resolution stage. Figures significantly higher than the total average are marked by a blue arrow, and those lower by a purple arrow.
Those in the informal stages of the dispute resolution process were more likely to be making enquiries about topics such as absence, sickness and stress; holidays and working time; and maternity, paternity and adoption. Conversely, those in the formal stages were more likely to be making enquiries about issues such as diversity and discrimination; wages; and discipline, dismissal and grievance.
| Total (4593) | Information request (1,014) | Informal action (896) | Formal action (2,432) | Employment tribunal (236) | |
|---|---|---|---|---|---|
| Absence, sickness and stress | 8% | 10% | 10% | 7% | 2% |
| Contracts | 13% | 15% | 15% | 13% | 8% |
| Diversity and discrimination | 6% | 5% | 4% | 7% | 8% |
| Employment agencies | 1% | 1% | 1% | 1% | 2% |
| Family friendly policies | 1% | 1% | 1% | 1% | 0% |
| Holidays and working time | 8% | 10% | 10% | 6% | 5% |
| Maternity, paternity and adoption | 3% | 6% | 4% | 2% | 1% |
| Redundancy, lay-offs and business transfers | 15% | 16% | 15% | 14% | 15% |
| Wage-related issues | 11% | 8% | 10% | 11% | 25% |
| Discipline, dismissal and grievance | 27% | 21% | 22% | 32% | 30% |
| Others | 7% | 8% | 6% | 6% | 6% |
4.1.6 Nature of the query
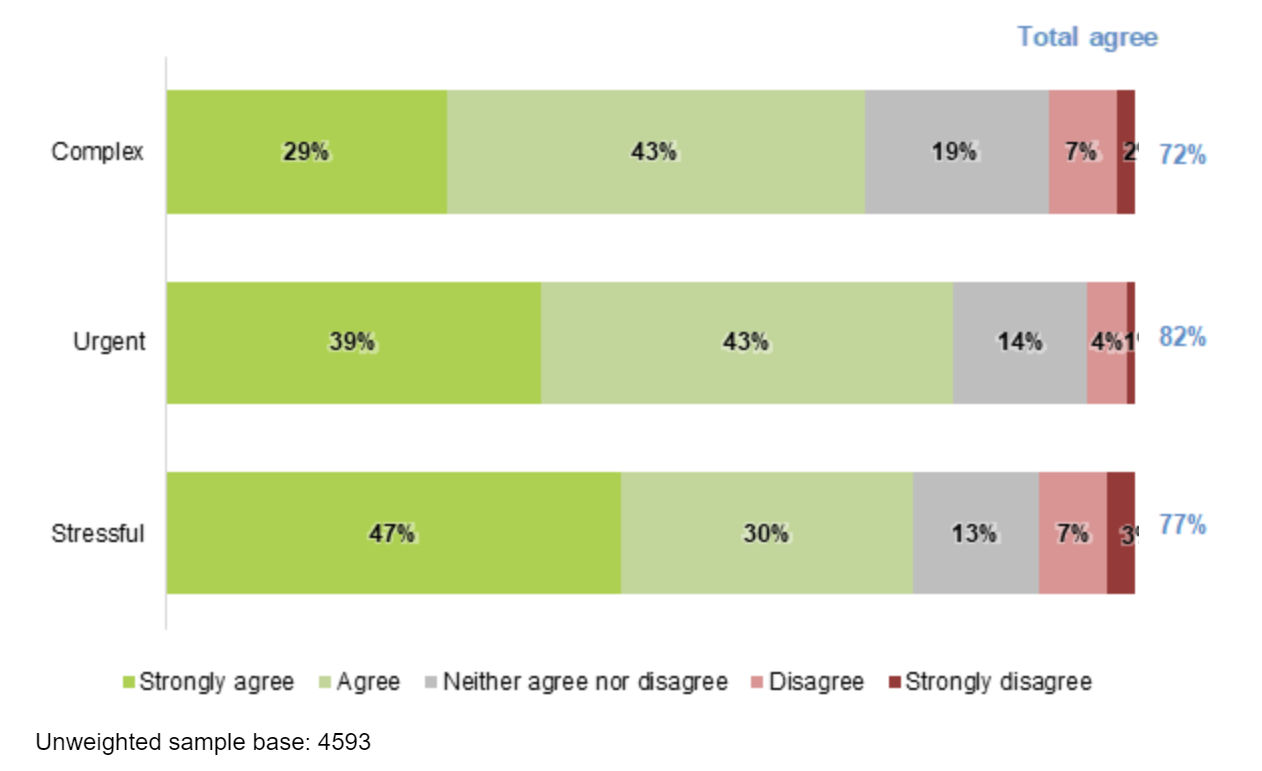
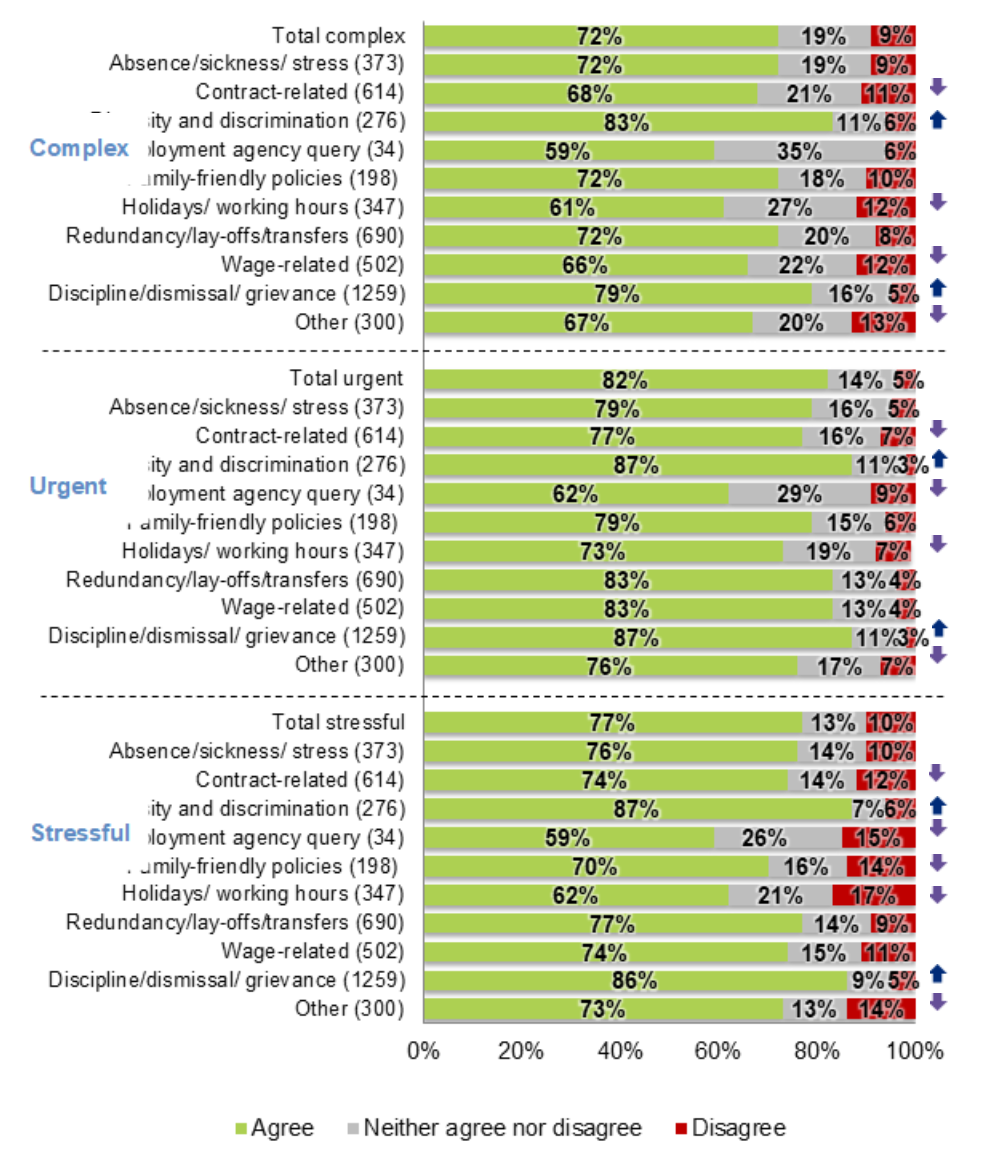
Respondents were asked the extent to which they agreed or disagreed that their enquiry was complex, urgent and stressful. Overall, there was a strong level of agreement with all of these statements, as highlighted in the chart below.
There were several significant subgroup findings for this question, which are outlined below:
4.1.6.1 Main subject of call
As highlighted in Figure 12, those calling about diversity and discrimination or discipline/ dismissal/ grievance were significantly more likely to agree with all 3 statements.
Complex – 83% of those making a diversity and discrimination related enquiry agreed that their query was complex, compared with 72% total average. This figure was 79% for those making a query about discipline, dismissal or grievance.
Urgent – 87% of those making a diversity and discrimination related enquiry agreed that their query was urgent, compared with 82% total average. The figure for those making an enquiry about discipline, dismissal or grievance was also 87%.
Stressful – 87% of those making a diversity and discrimination related enquiry agreed that their query was stressful, compared with 77% total average. This figure was 86% for those calling about discipline, dismissal or grievance.
4.1.6.2 Caller type
Employers/ employer representatives were significantly less likely to agree against all 3 measures than employees/ former employees/ employee representatives. This finding is likely to be linked to the reasons that these respondents were calling - as highlighted in the previous sections, employers were significantly less likely to be calling about discipline, dismissal and grievance or issues of diversity and discrimination.
Complex – 69% of employers/ employer representatives agreed that their query was complex, compared with 73% of employees.
Urgent – 74% of employers/ employer representatives agreed that their query was urgent, compared with 83% of employees/ former employees/ employee representatives. Former employees were particularly likely to agree that their query was urgent (85%).
Stressful – 52% of employers/ employer representatives agreed that the issue they were calling about was stressful, compared with 82% of employees/ former employees/ employee representatives.
4.1.6.3 Dispute resolution stage:
Complex – Those at the informal request and informal action stage were significantly less likely to agree that the issue they were calling about was complex (69% for both compared with 72%), while those at the formal action stage were significantly more likely (75% compared with 72%).
Urgent – Those at the information request stage were significantly less likely to agree that their query was urgent (77% compared with 82%), while those at the formal action and employment tribunal stage were significantly more likely (83% and 88% respectively compared with 82%).
Stressful – Those in the formal action and employment tribunal stages were significantly more likely to agree (81% and 84% respectively compared with 77%). Over half of these respondents strongly agreed that their query was stressful (formal action – 51%, employment tribunal – 58%).
4.1.6.4 BME and disability status
BME respondents and those with a long-term disability were significantly more likely to agree with all 3 statements compared to the total average. This again correlates with the main subject of the enquiry: both BME and disabled respondents were significantly more likely to be calling about an issue related to diversity and discrimination (13% and 13% respectively compared with 6%).
Complex – 77% of respondents who self-identified as having a disability or long-term illness agreed that their query was complex, compared with 72% total average. This figure was also 77% for BME respondents.
Urgent – 86% of those with a disability/ long-term illness and 84% of BME respondents agreed that their query was urgent, compared with 82% total average.
Stressful – 81% of those with a disability/ long-term illness and 85% of BME respondents agreed that their query was stressful, compared with 77% total average.
Unweighted sample bases in parenthesis
5. Journey to the helpline service
5.1 How did you find out about the helpline?
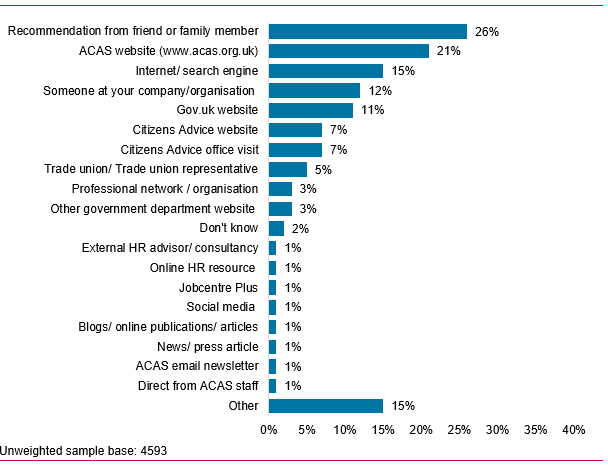
Respondents were asked how they found out about the Acas helpline. The chart below illustrates their responses. Options selected by less than 1% of respondents have been excluded. The most common response was that they had heard about the helpline through a friend or family member (26%). This is a positive finding, since it indicates that people are recommending the helpline as a useful source of information.
The next most popular response was that respondents found out about the helpline online, either through the Acas website (21%) or through a general internet search (15%). Respondents were unlikely to have heard about the helpline via social media, with just 1% selecting this option.
15% of respondents selected the ‘other’ option for this question. When asked to specify further, popular answers were that they had used the service in the past, professional knowledge (for example through working in finance, HR or law), and through seeking legal advice elsewhere. Others referenced charities such as Mind and Epilepsy Action. Some also mentioned their GPs or NHS councillors.
5.1.1 Awareness of helpline – by subgroup
There are some variations in these findings according to subgroups of respondents.
By completion mode
Just 4% of those who completed the survey by telephone stated that they had heard about the helpline via the Acas website, compared to 22% who had completed it online. However, 19% of those who completed the survey by telephone had found out about the helpline through an internet search engine, compared to 14% who completed the survey online.
By caller type
Employers were significantly more likely than employees to have found out about the helpline through the Acas website – 33% of employees and managers found out about the helpline in this way, compared to 19% of employees, 16% of former employees and 18% of employee representatives.
This may indicate that more could be done to promote the Acas website amongst employees. Employees and former employees were most likely to have heard about the helpline through family members or friends – 30% and 34% respectively, compared with 10% of employers or managers.
By employment status
Those in full-time employment were significantly more likely than those unemployed to have heard about the helpline via the Acas website (22% compared with 15%). Just 4% of apprentices had heard about the helpline through the Acas website, although given the sample size for this cohort (25 respondents) this finding should be treated as indicative.
By dispute resolution stage
Those in the formal stages of the process were significantly more likely to have heard about the helpline through the Citizens Advice office – 8% of those at the formal action stage and 11% of those at the tribunal stage, compared to 7% of the total sample. Those at the employment tribunal stage were also significantly more likely to have heard about the helpline through their trade union (8%, compared with 5%) and through the Citizens Advice website (11% compared with 7%).
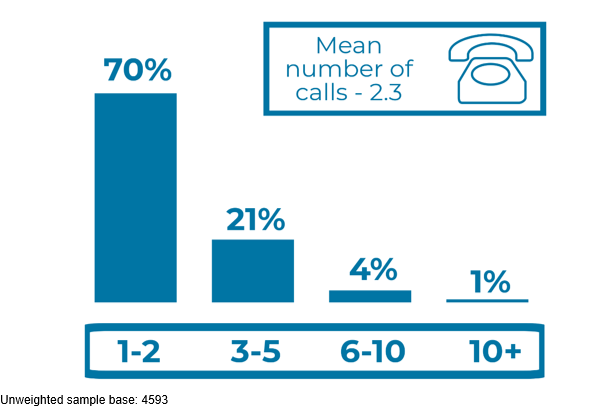
5.2 Number of calls in the past 12 months
Respondents were asked how many calls to the Acas helpline they had made in the past twelve months. The mean number of calls made amongst the sample group was 2.3. Seven in 10 respondents had made 1 or 2 calls, while just over 2 in 10 (21%) had made 3-5. This relatively low number of calls suggests that enquiries are being resolved in a timely manner, without the need for repeat communications.
On average, employers and their representatives made a significantly higher number of calls, with a mean of 3.2 calls for employers or managers and 3.6 calls for employer representatives. Conversely, employees/ former employees/ employee representatives made a significantly lower number of calls, with the mean for this group being 2.2.
Respondents who were calling in relation to an employment tribunal also made a higher number of calls on average (2.9, compared with 2.3). This is likely to be due to the ongoing nature of employment tribunals in comparison to one-off information requests. Enquiries related to diversity and discrimination or to discipline, dismissal or grievance also resulted in higher than average call volumes (2.9 and 2.5 respectively compared with 2.3).
5.3 Use of alternative communication channels
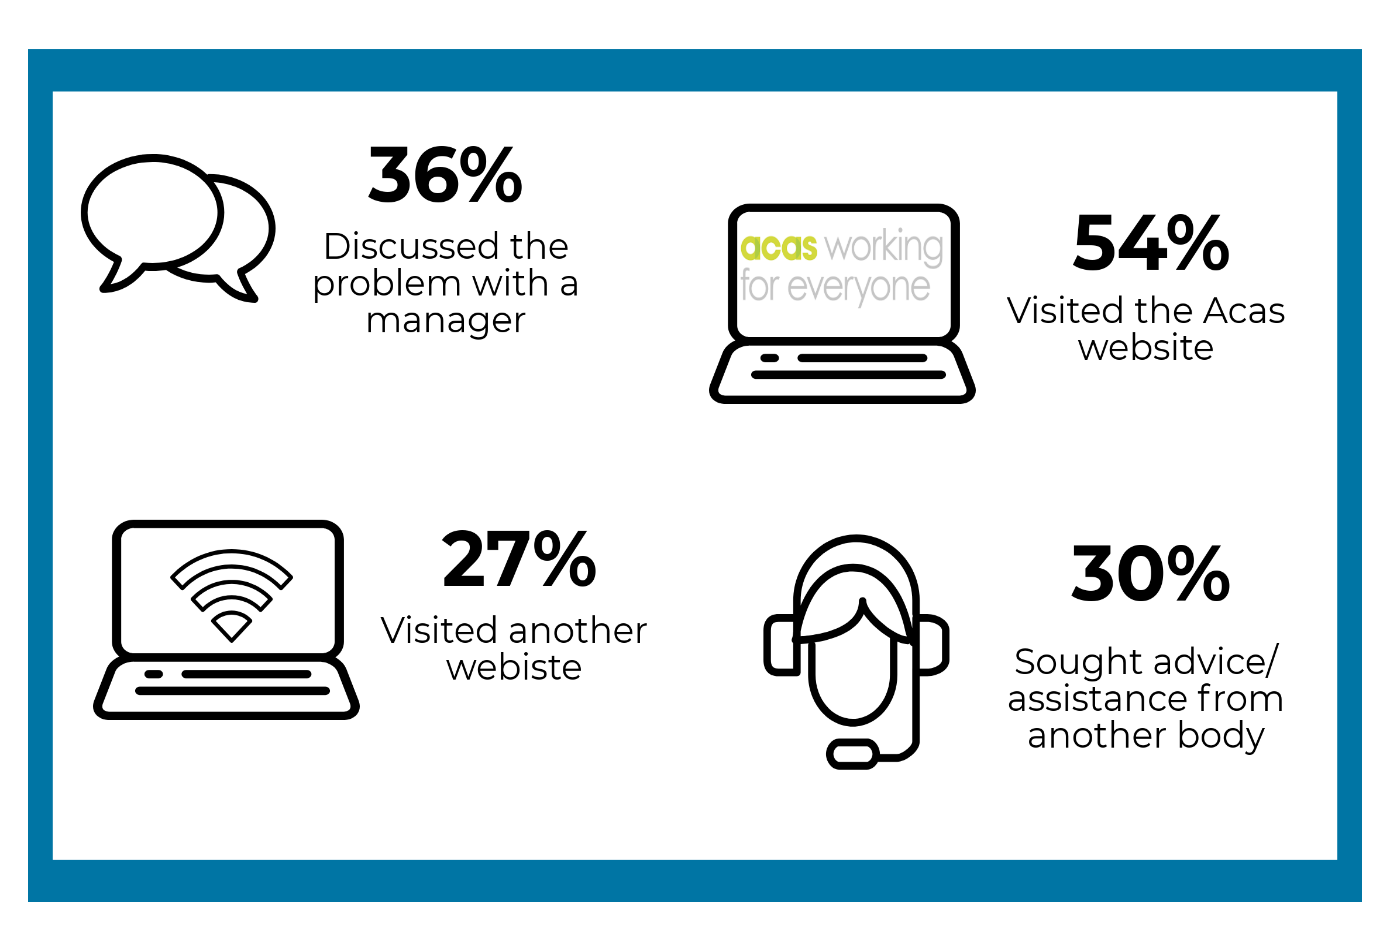
Respondents were asked whether they had tried to resolve their query in another way prior to calling the helpline, and, if so, how. They were able to select as many options as were applicable. The results are shown in the figure below.
Over half (56%) had visited the Acas website, and 38% had discussed the issue with their manager. 3 in 10 (31%) had also sought advice from another body; for example, a trade union, a solicitor or the Citizens Advice Bureau.
Employers or employer representatives were significantly more likely to have visited the Acas website (66% compared with 56%) or another website (33% compared with 28%) to answer their query. Employees/ former employees/ employee representatives, meanwhile, were more likely to have sought advice or assistance from another body (34% compared with 31%). This finding could reflect the fact that employers were more likely to be calling about issues such as holidays, working time and family-related policies, where generic information is likely to be available online.
Conversely, employees were more likely to be raising issues such as diversity and discrimination or dismissal and grievance, where specific legal advice could be required. Indeed, when considering the main subject of the respondents’ call, 40% of those calling about diversity and discrimination sought advice from another body prior to calling the Acas helpline, as did 39% of those calling about discipline, dismissal or grievance.
Unweighted sample base: 4,404
5.3.1 Use of the Acas website
Respondents who did not visit the Acas website prior to calling the helpline were asked whether they had ever visited it previously, of which 43% had and 52% had not.
Employers or managers and their representatives were significantly more likely to have visited the website in the past (72%, 74% compared with 43%), while employees and former employees were significantly less (39%, 32% compared with 43%).
By employment status, those in full-time employment were significantly more likely to have visited the website (45% compared with 43%), while agency, temporary or zero-hours workers and those unemployed were significantly less likely (33%. 35% compared with 43%). As previously noted, this could indicate that more could be done to raise awareness of the Acas website amongst employees, particularly those in less stable forms of employment.
The chart below illustrates whether or not respondents had visited the Acas website in the past according to their employment status. Those significantly less likely to have visited the website in the past are highlighted by a purple arrow, and those significantly more likely by a blue arrow.
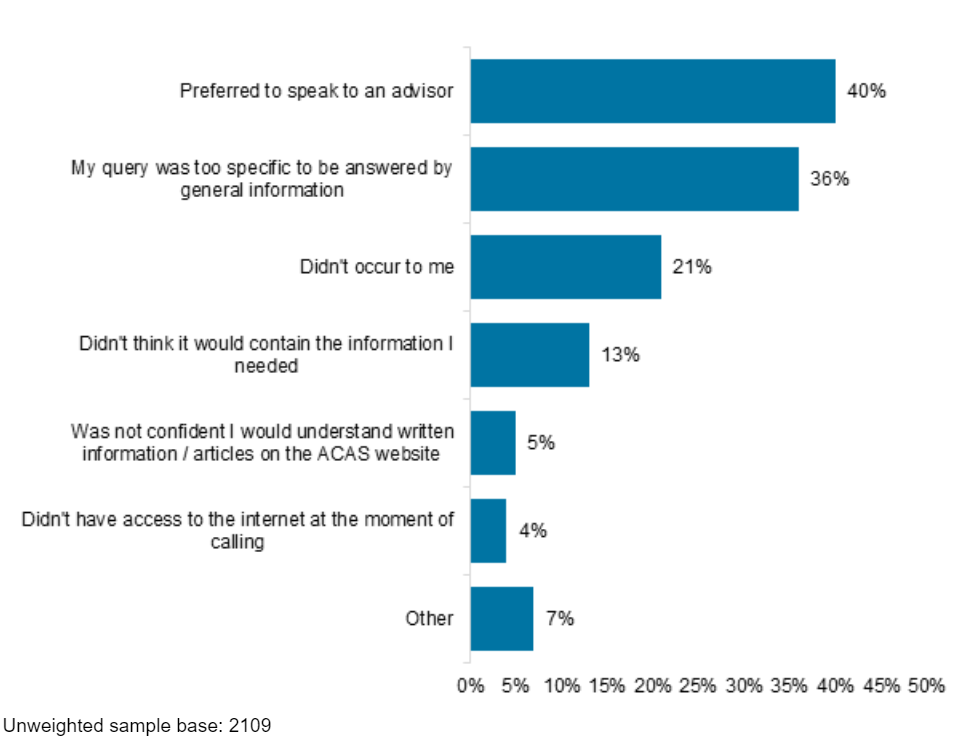
5.3.2 Reasons for not visiting the Acas website
Those who did not visit the Acas website prior to calling the helpline were asked their reasons why. The most common response to this question was that respondents would prefer to speak to an adviser (40%), followed by the query being too specific to be answered with general information (36%). 7% of respondents selected the ‘other’ options for this question. A common response here when asked to elaborate was that they had been not been aware of the website.
Employees/ former employees/ employee representatives were significantly more likely to state that they would prefer to speak to an adviser when compared to employers/ employer representatives (42% compared with 30%). Conversely, employers/ employer representatives were significantly more likely to state that their query was too specific (43%, compared with 35% of employees/ former employees/ employee representatives).
There were few significant differences according to the main subject of the call, although those with a contract-related enquiry were significantly more likely to state that their query was too specific (42% compared with 36%). Additionally, those with a diversity and discrimination related enquiry were significantly more likely to state that they were not confident that they would understand the information on the website (10% compared with 5%), as were those with a disability or long-term illness (7% compared with 5%).
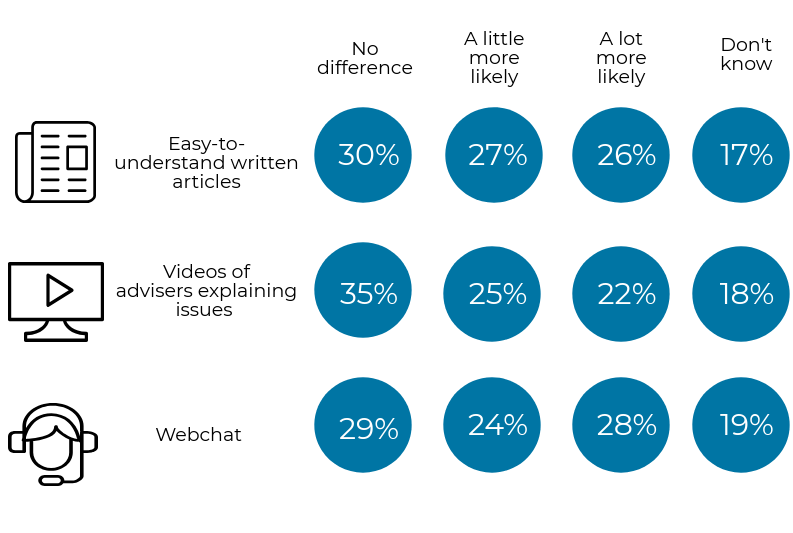
5.3.3 Encouraging website usage
Respondents who had not visited the website were asked whether they would be more likely to use it if it offered easy-to-understand written articles, videos of advisers explaining issues, or webchats. Just over half stated that they would be more likely to use the website if it offered easy-to-understand written articles (53%) or a webchat function (52%), while 47% affirmed that they would be more likely to use it if it had videos of advisers explaining issues.
A sizeable proportion of respondents were not sure whether these options would make a difference to their decision to use the website, or stated that it would make no difference to their decision.
There are few significant differences in these findings according to subgroup:
Those who were unemployed were significantly more likely to say that easy-to-understand written articles and videos of advisers explaining issues would make them ‘a lot more likely’ to use the website – 34% for the former and 29% for the latter, compared with 26% and 22% total average.
Additionally, those for whom diversity and discrimination was the main topic of their enquiry were significantly more likely to state that a webchat function would make them ‘a lot more likely’ to use the website (39% compared with 28% total average). These respondents were also significantly more likely to state that easy-to-understand written articles would make them ‘a little more likely’ to use the website (36%, compared with 27% total average).
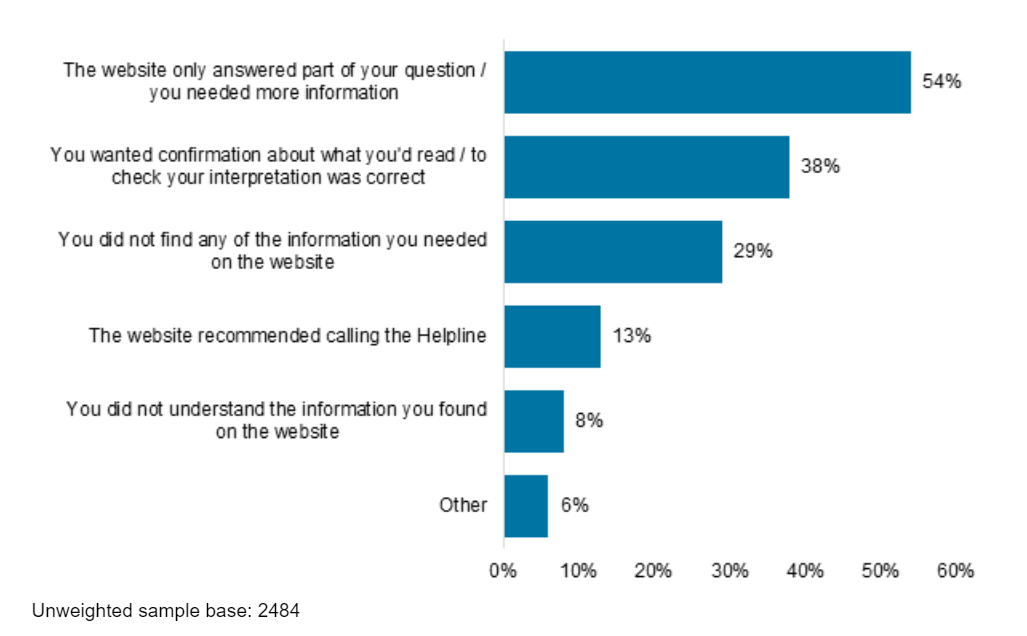
5.3.4 Reasons for calling after visiting the website
Those who had visited the Acas website prior to their call were asked why they called the helpline afterwards. The most common reason cited was that the website only answered part of their question or that they needed more information (54%). This was followed by wanting confirmation about what had been read (38%) and not finding any of the necessary information (29%). Further analysis by subgroup finds:
By dispute resolution stage, those at the information request stage were significantly more likely to state that they could not find any of the information needed (34% compared with 29%). Those at the informal action stage were significantly more likely to state that the website only answered part of their question (60% compared with 54%), while those at the tribunal stage were most likely to state that the website recommended calling the helpline (32% compared with 13%).
By caller type, employers/ employer representatives were significantly more likely to state that they could not find any of the information needed (36%, compared with 27% employees/ former employees/ employee representatives). Conversely, employees/ former employees/ employee representatives were more likely to state that they did not understand the information (9%, compared with 5% of employers/ employer representatives) or that they wanted confirmation about what they had read (40%, compared with 28% employers/ employer representatives). Former employees were most likely to say that the website had recommended calling the helpline (25%, compared with 13% total average).
By main subject of enquiry, those calling about absence, sickness or stress and contract related enquiries were significantly more likely to say that they didn’t find any of the information that they needed on the website (39% and 36% respectively compared with 29%). Those with a diversity and discrimination related enquiry were most likely to say that the website had recommended calling the helpline (22%, compared with 13%). Those with wage-related enquiries were also significantly more likely to cite this reason (19% compared with 13%).
6. Accessing the helpline
6.1 Number of call attempts
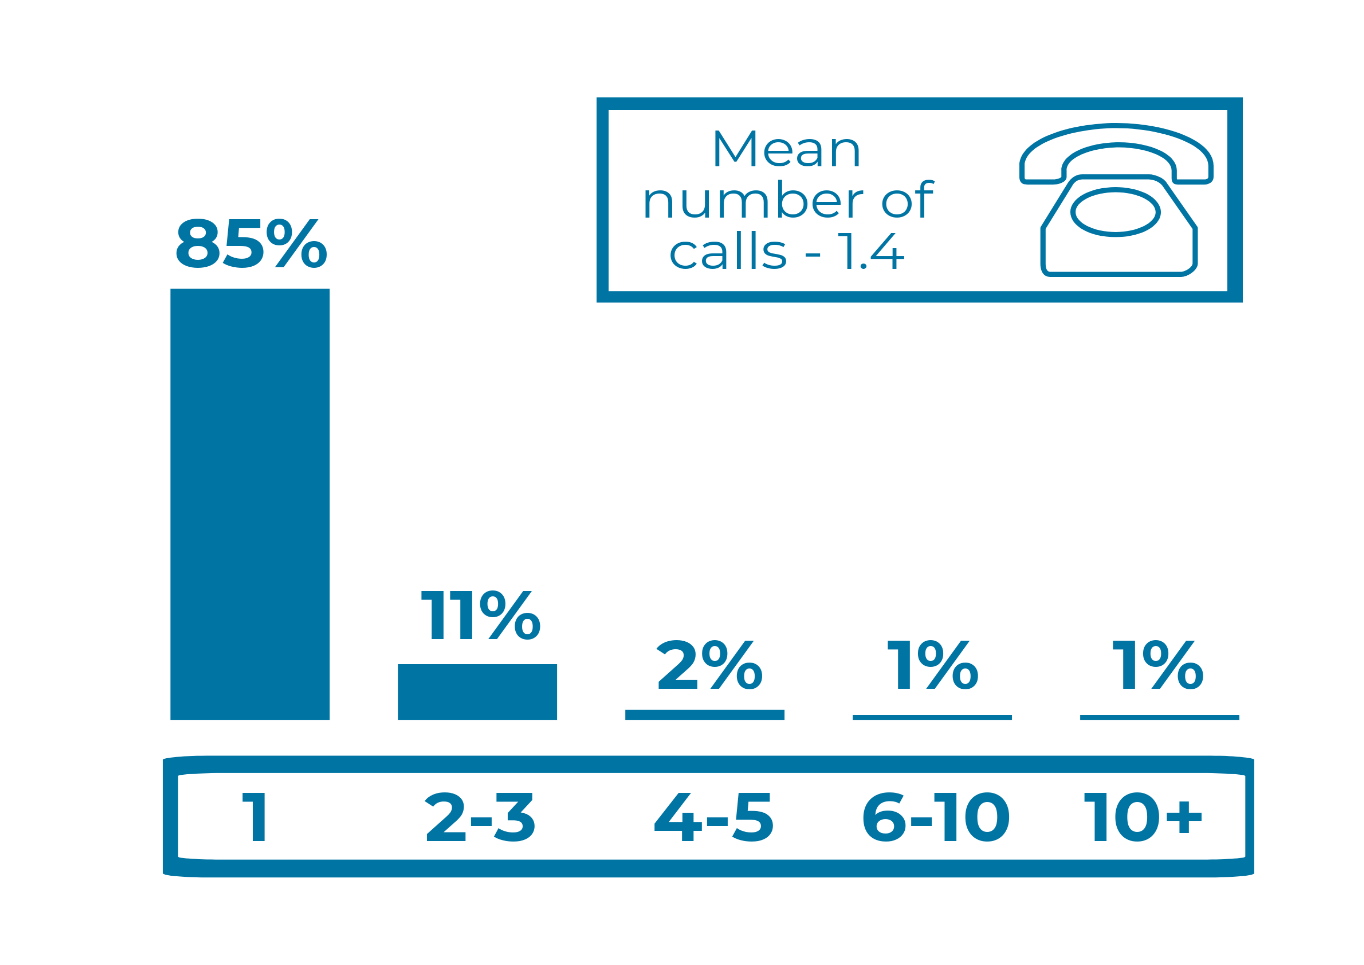
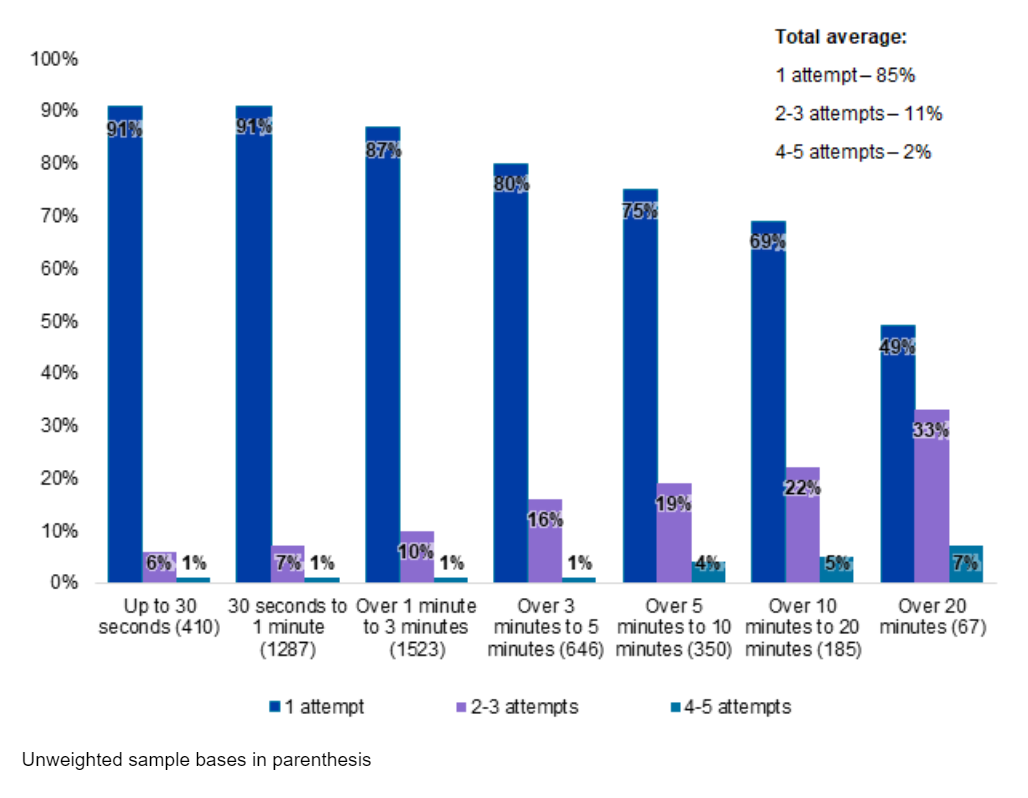
Respondents were asked how many times in total they had called the helpline before getting through to someone. Encouragingly, the majority of respondents (85%) only needed to call the helpline once. A further 11% stated that they called the helpline 2-3 times, and 2% that they had called 4-5 times. The mean number of calls made was 1.4.
Unweighted sample base: 4,593
6.1.1 Number of call attempts – by month of call
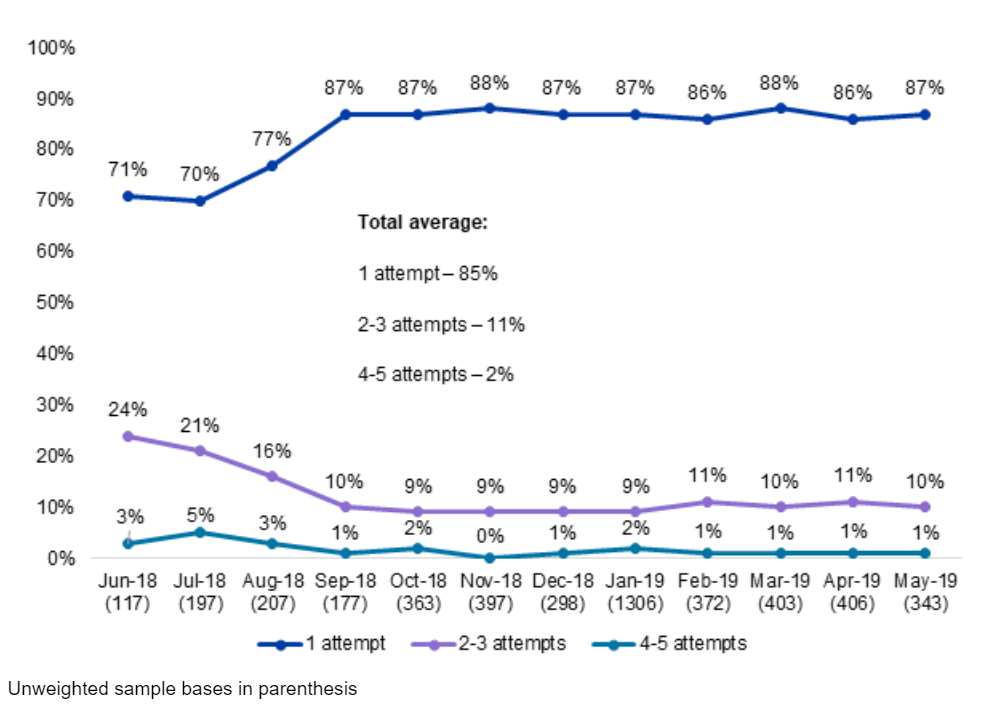
The chart below shows the number of call attempts according to the month in which the call was made. Respondents who called the helpline between June 2018 and August 2018 were significantly more likely to have made 2-3 call attempts, or, in July and August 2018, 4-5 call attempts.
Call attempts of 6-10 and more than 10 have been excluded from the chart due to the low proportion of respondents selecting these responses.
6.2 Time taken for call to be answered
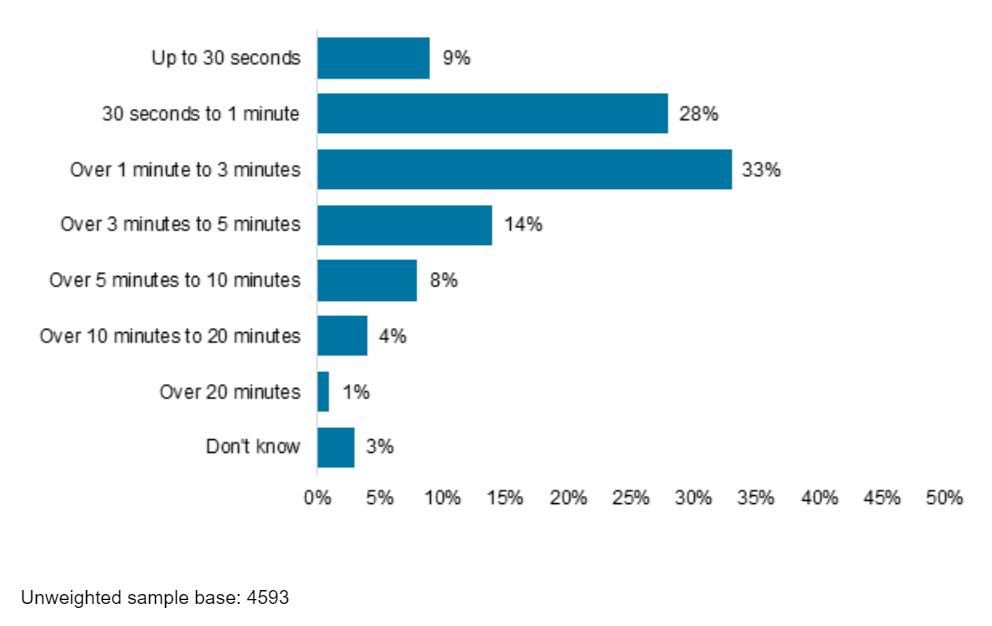
Respondents were also asked how long it took for their call to be answered. The most common wait time was over 1 minute to 3 minutes (33%), followed by 30 seconds to 1 minute (28%).
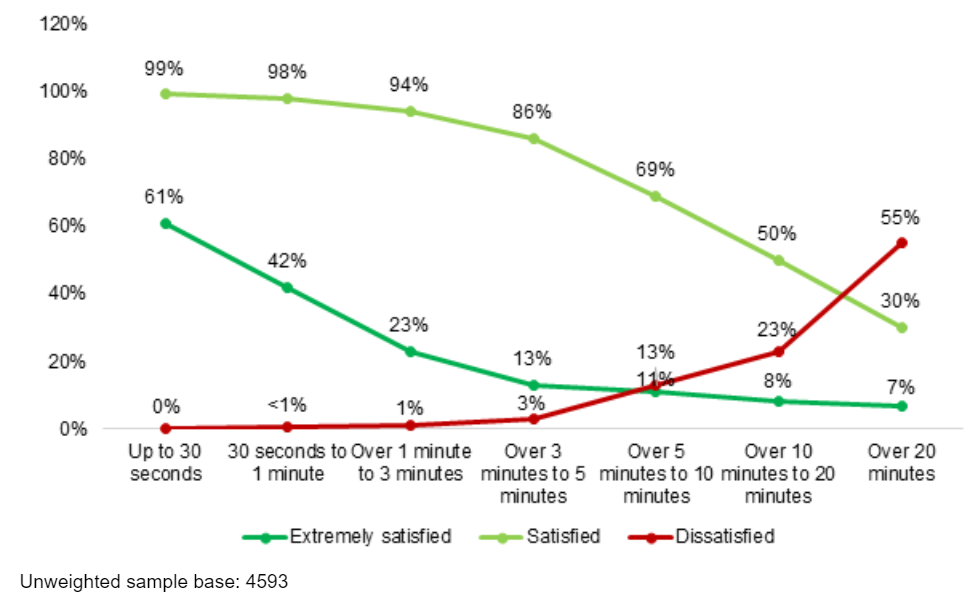
Just 5% of respondents stated that they waited over 10 minutes for their call to be answered, and just 1% over 20 minutes. Still, more than 2 in 10 respondents (22%) waited between 3 and 10 minutes for their call to be answered. As discussed in section 8, satisfaction with the overall service starts to decline as call-wait times increase beyond 3 minutes, and so reducing the number of callers waiting for this long could improve satisfaction levels.
6.2.1 Call wait times – by month of call
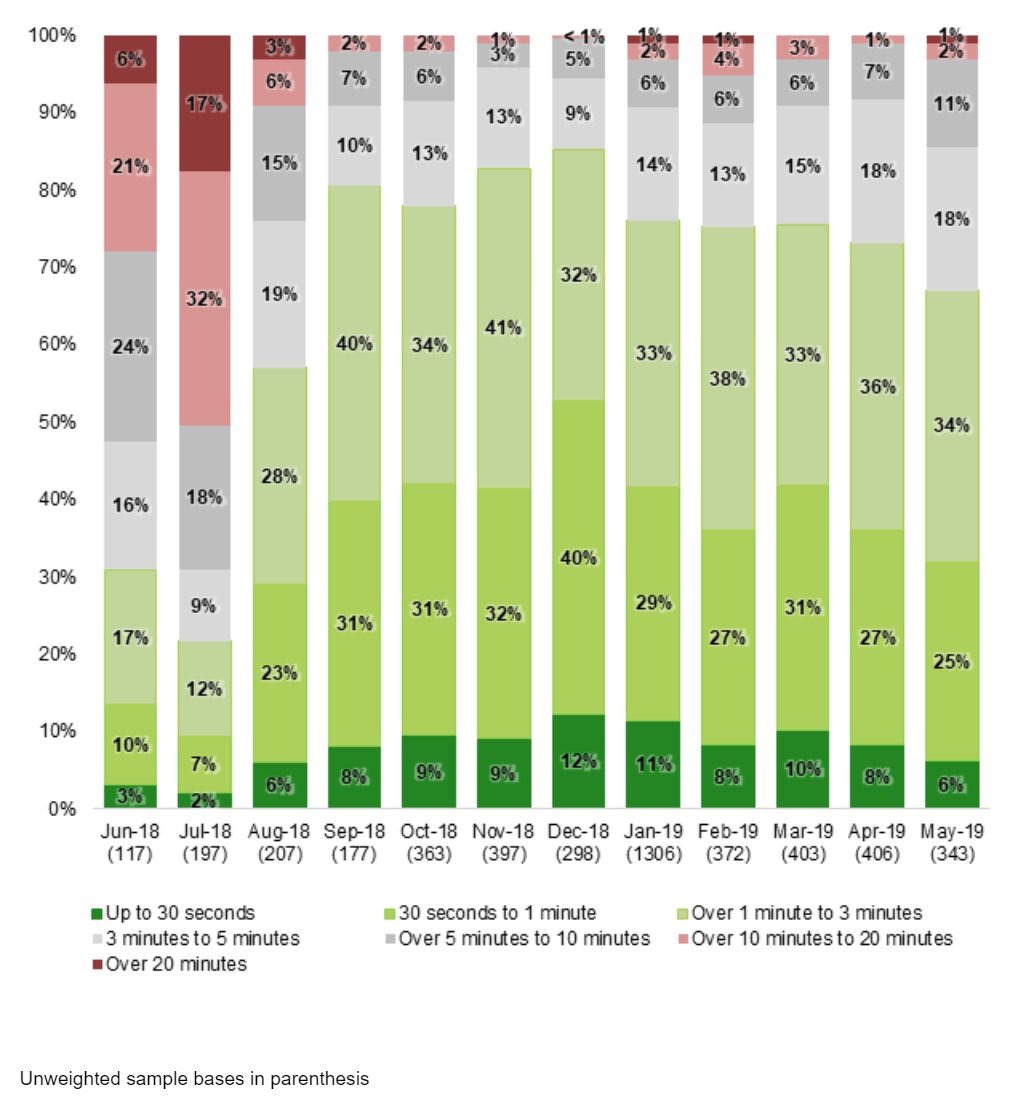
There are some significant differences in call wait times according to the month that the call was made, as highlighted in the chart below. Wait times of less than 1 minute increase substantially after July 2018, while wait times of more than 10 minutes decline. Wait times of more than 3 minutes start to increase again from January 2019, but are still far lower than pre-August 2018 levels. From August 2018 onwards, the majority of respondents reported wait times of less than 3 minutes for their call to be answered.
6.2.2 Relationship between number of call attempts and time taken for call to be answered
There is a relationship between the number of call attempts made by respondents and the time taken for their call to be answered, with those who had waited for more than 3 minutes being significantly more likely to have made more than one call attempt. It may be that those who had tried to get through to the helpline previously were more willing to hold the line in order for their query to be answered.
This relationship is demonstrated in the chart below. As before, call attempts of more than 5 have been excluded due to low base sizes.
6.2.3 Satisfaction with wait time
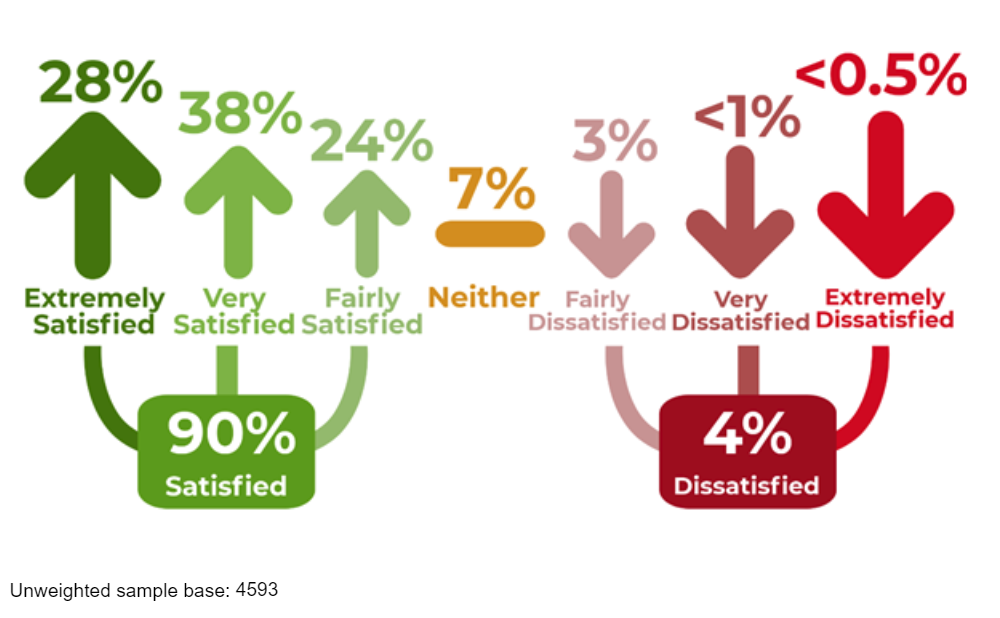
Respondents were asked how satisfied they were with the wait time for their call to be answered. Encouragingly, 9 in 10 respondents (90%) were at least somewhat satisfied with the call wait-time, while just 4% were dissatisfied. Less than 1% of respondents stated that they were very or extremely dissatisfied with their call wait time.
Unsurprisingly, there is a direct correlation between call wait times and satisfaction, with satisfaction declining significantly as wait times become longer. This relationship is demonstrated in the chart overleaf. Other notable findings are as follows:
Those calling between June and August 2018 were significantly less likely to be satisfied with their call wait time, and significantly more likely to be dissatisfied. This is likely to be due to increased call wait times and number of call attempts during these months, as highlighted in the previous section.
Those who made just 1 call attempt were more likely to be satisfied with their call wait time (92% compared with 90%), while those who made between 2 and 10 call attempts were all significantly less. This is likely due to the fact that those making more call attempts had generally experienced longer wait times, as discussed in the section above.
Those who completed the survey online were significantly less likely to be satisfied with their call wait times than those who completed the call by telephone (89% compared with 93%). There is no correlation between call wait time and method of completion, but it is not unusual for telephone interviews to result in slightly higher satisfaction levels.
| Total (4,593) | 1 attempt (3,920) | 2-3 attempts (500) | 4-5 attempts (71) | 6-10 attempts (32) | 10 + attempts (36) | |
|---|---|---|---|---|---|---|
|
Extremely satisfied |
28% |
31% | 12% | 11% | 31% | 33% |
| Very satisfied |
38% |
39% | 32% | 15% | 25% | 33% |
| Fairly satisfied |
24% |
22% | 36% | 41% | 19% | 19% |
| Neither satisfied nor dissatisfied |
7% |
6% | 12% | 11% | 3% | 3% |
| Fairly dissatisfied |
3% |
2% | 6% | 14% | 3% | 6% |
| Very dissatisfied |
1% |
1% | 2% | 3% | 9% | 0% |
| Extremely dissatisfied |
<1% |
<1% | 1% | 4% | 9% | 6% |
| Summary: Satisfied |
90% |
92% | 79% | 68% | 75% | 86% |
| Summary: Dissatisfied |
4% |
2% | 9% | 21% | 22% | 11% |
6.2.4 Recorded messages
Before speaking to an adviser, Acas helpline callers are offered the opportunity to listen to any number of interactive voice response (IVR) messages on common topics of enquiry. The callers are able to transfer to an adviser either during or after the recording.
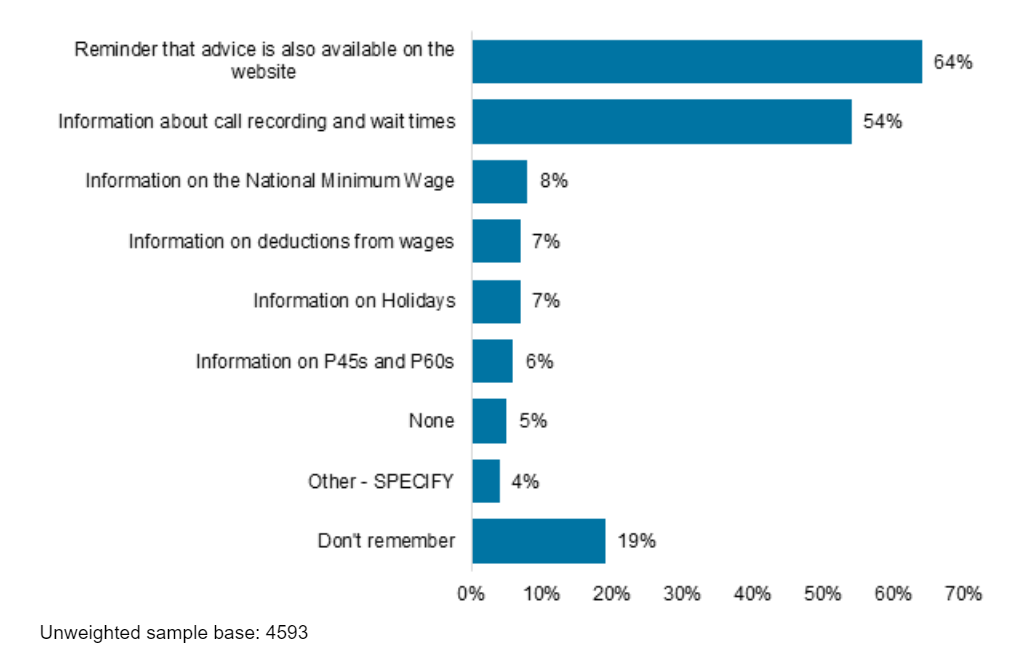
Respondents were asked about the kind of IVR messages that they listened to while waiting for their call to be answered. Overall, almost two-thirds (64%) stated that they had heard a reminder that advice is also available on the Acas website. Over half (54%) confirmed that they had heard information about the call being recorded and wait times.
However, less than 10% of respondents selected any of the remaining options, which related to common topics of enquiry such as information on the National Minimum Wage and holidays. Being that these messages were optional, it is likely that most respondents decided not to listen to them, either because they did not consider that the information would be relevant, or because they wanted to speak to an adviser as quickly as possible.
Almost 2 in 10 respondents (19%) could not remember which IVR messages they had heard. This finding, alongside the low rate of respondents listening to the optional messages, indicates that IVR messages may not be the most effective means of conveying information to helpline users.
6.2.5 Recorded messages – by time lag between call and survey
Interestingly, a higher time lag between the call taking place and the survey being completed resulted in a significantly higher proportion of respondents stating that they had listened to the optional IVR messages, as highlighted in the table overleaf. Additionally, those who answered the survey by telephone were more likely than total average to state that they had listened to these messages, while those who answered the survey online were less likely. There are some possible reasons for these findings:
As noted in the methodology section, most respondents who experienced a high time lag between making their call and completing the survey were telephone respondents – 95% of those experiencing a 26-30 day time lag, 99% of those experiencing a 26-30 day time lag, and 100% of those experiencing a time lag of over 35 days. As such, there is a correlation between the 2 findings.
A higher time lag between making the call and completing the survey is likely to have resulted in respondents remembering which messages they had listened to less clearly.
It is sometimes the case that telephone interviews can result in ‘over-claim behaviour’. In this case, respondents may have been less willing to admit that they couldn’t remember which messages they had heard, instead selecting the messages which sounded likely or familiar.
The tables overleaf show responses to this question according to time lag between the call and completing the survey and to survey completion mode. Figures significantly lower than the total average are shown by a purple arrow, and those significantly higher by a blue arrow.
| Total (4,593) | 0-5 days (732) | 6-10 days (1,517) | 11-15 days (1,333) | 16-20 days (501) | 21- 25 days (102) | 26-30 days (168) | 31-35 days (138) | Over 35 days (102) | |
|---|---|---|---|---|---|---|---|---|---|
| Information about call recording and wait times |
54% |
60% | 55% | 50% | 52% | 46% | 56% | 56% | 53% |
| Reminder that advice is also available on the website |
64%
|
68% | 63% | 60% | 61% | 70% | 76% | 73% | 72% |
| Information on the National Minimum Wage |
8% |
8% | 9% | 6% | 6% | 17% | 23% | 14% | 22% |
| Information on holidays |
7% |
7% | 7% | 5% | 3% | 14% | 17% | 14% | 19% |
| Information on deductions from wages |
7% |
7% | 7% | 5% | 5% | 7% | 20% | 12% | 16% |
| Information on P45s and P60s |
6%
|
6% | 5% | 4% | 4% | 7% | 20% | 20% | 15% |
| Other - specify |
4% |
5% | 4% | 4% | 3% | 3% | 5% | 4% | 5% |
| Don't remember | 13% | 18% | 22% | 23% | 20% | 13% | 20% | 21% | |
| None |
5%
|
5% | 5% | 5% | 4% | 5% | 3% | 4% | 3% |
|
Total (4,593)
|
Online (4,115) | Telephone (478) | |
|---|---|---|---|
| Information about call recording and wait times |
54% |
53% | 56% |
| Reminder that advice is also available on the website |
64% |
63% | 76% |
| Information on the national minimum wage |
8% |
7% | 21% |
| Information on holidays |
7% |
6% | 17% |
| Information on deductions from wages |
7% |
6% | 16% |
| Information on P45s and P60s |
6% |
5% | 18% |
| Other - specify |
4% |
4% | 5% |
| Don't remember |
19% |
19% | 16% |
| None |
5% |
5% | 3% |
6.2.6 Recorded messages – by time taken for call to be answered
There is also a relationship between time taken for the call to be answered and responses to this question, as shown in the table below:
Those waiting for less than 1 minute were significantly less likely than total average to state that they had listened to most of the IVR messages. It is possible that either these respondents did not opt to hear the optional IVR messages, or that their call was answered before the messages could be played or completed.
Those waiting between 1 and 3 minutes were significantly more likely to recall listening to several of the IVR messages. This finding is to be expected, since those waiting for a longer time are more likely to hear the recorded messages.
| Total (4,593) | Up to 30 seconds (410) | 30 seconds to 1 minute (1,287) | Over 1 minute to 3 minutes (1,523) | Over 3 minutes to 5 minutes (646) | Over 5 minutes to 10 minutes (350) | Over 10 minutes to 20 minutes (185) | Over 20 minutes (67) | |
|---|---|---|---|---|---|---|---|---|
| Information about call recording and wait times |
54% |
45% | 53% | 56% | 58% | 58% | 57% | 54% |
| Reminder that advice is also available on the website |
64%
|
53% | 62% | 67% | 66% | 71% | 75% | 75% |
| Information on the national minimum wage |
8% |
7% | 8% | 9% | 8% | 9% | 11% | 9% |
| Information on holidays |
7%
|
7% | 6% | 8% | 7% | 6% | 6% | 10% |
| Information on deductions from wages |
7% |
4% | 6% | 8% | 9% | 7% | 9% | 9% |
| Information on P45s and P60s |
6%
|
5% | 5% | 7% | 7% | 5% | 5% | 7% |
| Other –specify |
4% |
4% | 4% | 5% | 4% | 3% | 3% | 1% |
| Don't remember |
19%
|
24% | 21% | 16% | 17% | 11% | 13% | 12% |
| None |
5% |
8% | 4% | 4% | 6% | 5% | 2% | 6% |
7. Call outcomes
7.1 Action taken as a result of call
Respondents were asked what further action they had pursued following their call to the Acas helpline. They were able to select as many options as were applicable from a given list.
Acas’s Key Performance Indicator (KPI) for the headline is ‘The percentage of users who were able to take clear action following their call to the Acas helpline’, the target for which is 70%. Encouragingly, this target has been achieved, with only around 12% of all respondents taking no further action after calling the Acas helpline.
The most common action taken is discussing the problem with management/ employee(s)/ HR, with 2 in 5 (41%) respondents doing so. This increases to half (49%) for employers/ employer representatives. 3 in 10 employers/ employer representatives (30%) have applied or implemented the changes recommended by Acas, representing the second-most common action taken by this group. Around 1 in 5 respondents (19%) submitted a formal complaint under their organisation’s grievance procedure, increasing to 22% for employees/ former employees/ employee representatives.
The proportion of those calling the Acas helpline again or visiting the website again after the contact in question lies at around the 1 in 10 mark. The proportion of all respondents is 12% and 9% respectively. For employers/ employer representatives, this is 8% and 7% respectively. This could be viewed as a positive result and indicative of the overall service provided by Acas.
1 in 5 respondents (20%) sought advice from another body, falling to 1 in 10 for employers/ employer representatives (10%), as is further elucidated in section 7.1.1.
Unweighted sample bases in parenthesis
7.1.1 Seeking additional advice after calling the Acas helpline
The table below summarises the different avenues taken by those who sought additional advice after calling the Acas helpline, segmented by employer/ employer representative and employee/ former employee/ employee representative subgroups. The most common source of additional advice was a lawyer/ solicitor, cited by around half of all respondents.
The second most popular option for employees/ former employees/ employee representatives is trade unions (29%). For employers/ employer representatives, this is a professional network or organisation (13%).
Table 9: Q28 And which people, bodies or websites did you seek advice from after calling the Acas helpline? (valid responses)
| Where sought advice/assistance from another body (910) | Where sought advice… and employer/ employer representative (97) | Where sought advice… and employee/ former employee/ employee representative (834) | |
|---|---|---|---|
| Lawyer/ solicitor | 47% |
51% |
47% |
| Trade union/ Trade union representative | 26% |
0% |
29% |
| Someone at my company/ organisation | 21% |
12% |
22% |
| GOV.UK website | 19% |
7% |
20% |
| Citizens Advice office visit | 16% |
0% |
17% |
| Citizens Advice website | 13% |
0% |
14% |
| Online publications/ articles/ blogs | 8% |
1% |
8% |
|
Other government department website (for example HMRC, DWP, HSE) |
8% |
9% |
8% |
| Social media (for example, LinkedIn, Twitter, Facebook) | 1% |
0% |
1% |
| Professional network/ organisation (for example CIPD) | 1% |
13% |
0% |
| Online HR resource (for example XpertHR) | 1% |
11% |
0% |
| External HR adviser/ consultancy | 1% |
11% |
0% |
| Employer association (website or other form of advice) | 0% |
4% |
0% |
| Other | 13% |
13% |
13% |
| Don't know/ Can't remember | 2% |
3% |
2% |
7.1.2 Reasons for seeking additional advice
2 in 5 respondents (42%) who sought additional advice or assistance from another body did so on the recommendation of their helpline adviser. A similar proportion (41%) had always planned to use other sources of information in addition to Acas.
Those considered to be at the employment tribunal stage of the dispute process were significantly more likely to say that they had always planned to use other sources of information (64% compared with 41%). This may be indicative of the requirement to use another source in order begin a claim through the tribunal process.
Those considered to be at the formal action stage of the dispute process were significantly more likely than total average to feel that their helpline adviser was unable to give them the information they wanted (14% compared with 12%).
7.2 Workplace changes as a result of call
Employers and employer representatives were asked whether the workplace they called about had updated or introduced any policies as a result of their call to the Acas Helpline. Around a quarter of these respondents (24%) stated that their workplace had introduced or updated policies as a result of the call. A further 28% stated that while their workplace had not yet updated or introduced policies, they did intend to.
Those calling about holidays or working time are significantly more likely to state that policies have been updated or introduced (41% compared with 24%). Additionally, those who completed the survey by telephone are significantly more likely to state that the workplace has introduced or updated policies (35% compared with 24%), while those who completed it online are significantly less likely (23% compared with 24%). As previously mentioned, this finding may partially result from ‘over-claim’ behaviour, with telephone respondents being less willing to reveal that their workplace had not updated their policies as a result of calling Acas.
7.3 Employment Tribunal claims
7.3.1 Before calling the Acas helpline
More than 2 in 5 employees (43%) had been thinking about making a claim to an employment tribunal prior to calling the Acas helpline. Those who called with subjects surrounding diversity and discrimination (64%), wage-related issues (55%) and discipline/ dismissal/ grievance issues (54%) were significantly more likely to have considered making a claim.
7.3.2 After calling the Acas helpline
At the time of the survey, 85% of employees/ former employees/ employee representatives stated that they had not yet made a claim to the employment tribunal or submitted an early conciliation notification of a claim to Acas.
However, 45% stated they were considering doing so. Those calling regarding diversity/ discrimination (24%), wage-related issues (26%) and discipline/ dismissal/ grievance (17%) were all significantly more likely to have made a claim to an employment tribunal or submitted an early conciliation notification of a claim to Acas when compared to the total average (15%).
7.3.3 Importance of call in deciding to claim
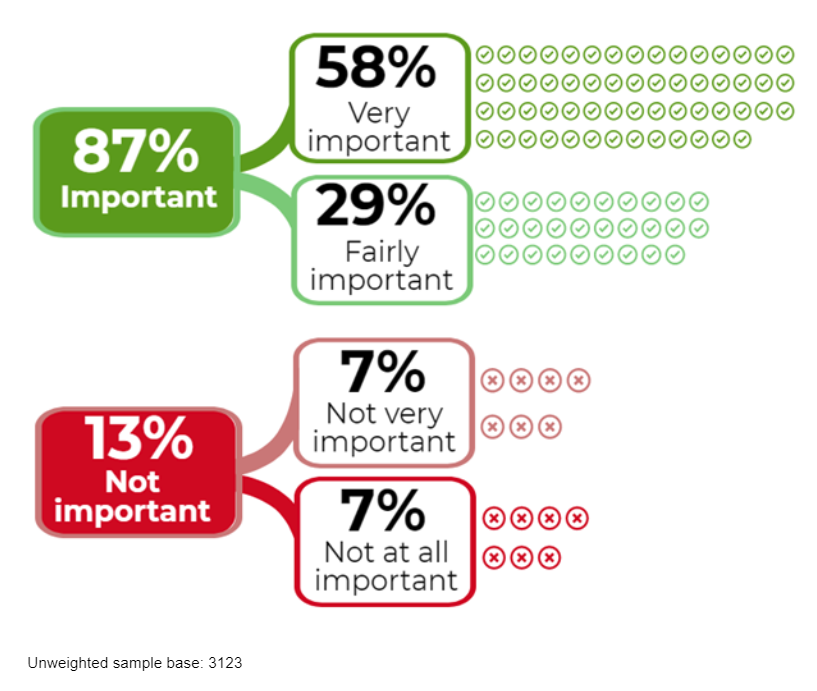
Nearly 9 in 10 employees felt their call to the Acas helpline was important in their decision about whether or not to make a claim to an employment tribunal, with over half (58%) feeling it was very important. This increases significantly to 74% among those who were extremely satisfied with the overall service of the helpline.
In addition, those who felt Acas undertook the most amount of effort to deal with their query (see section 8.7) were significantly more likely to feel their call to the helpline was very important in their decision (70% compared with 58%).
7.4 Employer concerns about a tribunal claim
Of the employers/ employer representatives who called the helpline, 1 in 7 (14%) did so in response to concerns of a claim to an employment tribunal from an employee.
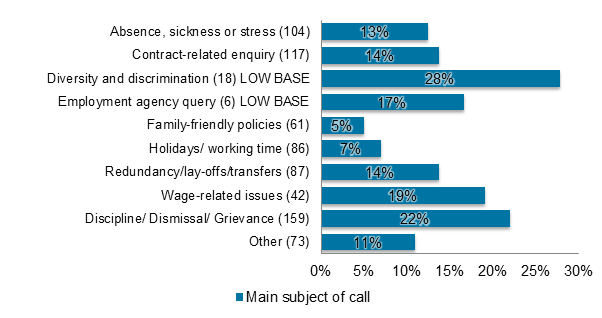
Employers whose main call subject was discipline/ dismissal/ grievance were significantly more likely to be calling in response to a tribunal claim (22% compared with 14%).
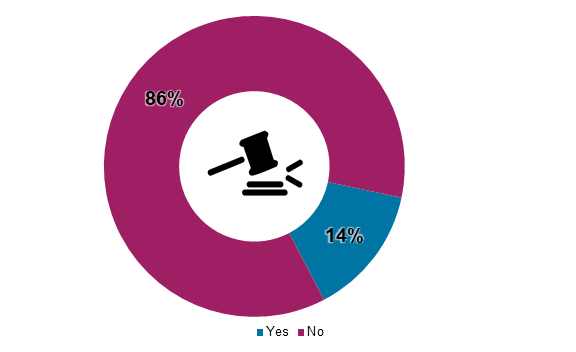
Unweighted sample base: 753
7.4.1 Usefulness of call in dealing with tribunal situation
Of those with concerns about a potential tribunal situation, almost two-thirds (64%) felt their call to the Acas helpline was very useful in helping them deal with the situation in question. Less than 1 in 10 (9%) felt their call was not useful. There are no significant differences between subgroups due to the low base sizes.
8. Satisfaction with helpline service
8.1 Overall satisfaction with service received
Very positively, more than 9 in 10 respondents are satisfied with the service they received from the Acas helpline, with almost half (46%) feeling extremely satisfied. Dissatisfaction lies at 1 in 20 (4%) with those who feel very and extremely dissatisfied amounting to 1% respectively.
8.1.1 Overall satisfaction – by subgroup
The chart below shows the overall satisfaction levels, segmented by various subgroups.
By completion mode, those who completed the survey online are significantly more likely to be extremely satisfied with the service received from Acas (47% compared with 46%).
Conversely, those who completed the survey over the telephone are significantly less (36% compared with 46%). This finding is likely to at least partly result from the time lag between the call and the survey taking place – significantly lower satisfaction is also shown by those who waited between 26 and 30 days between making their call and answering the survey (88% compared with 94%).
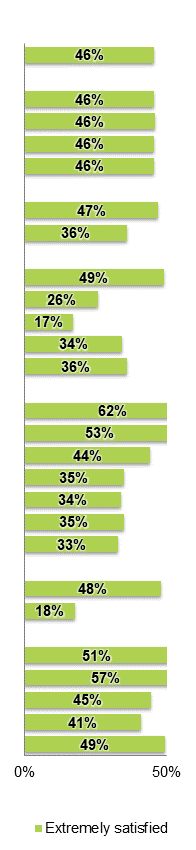
By number of call attempts, when the number of call attempts increases from 1 to 2-3, the proportion of those who are extremely satisfied drops by almost half (26% compared with 49%). This drops further still when 4-5 call attempts have been made (17% compared with 49%).
By call wait-time, satisfaction levels, as expected, are higher when calls are answered more quickly. When the time taken to answer is 30 seconds to 1 minute, satisfaction is at 95%, with 53% being extremely satisfied. However, when time taken to answer the call increases beyond 3 minutes, satisfaction drops to between 89% and 91%, and the proportion of those extremely satisfied drops to around 35%.
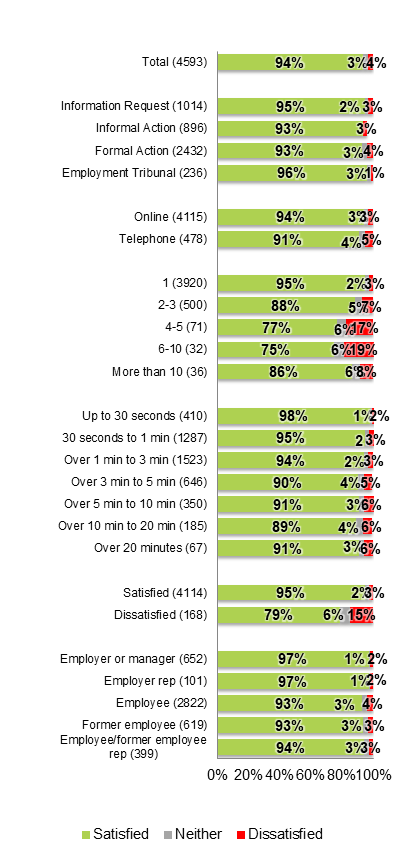
By caller type, employers/ employer representatives are significantly more likely to be satisfied (97% compared with 93%) and extremely satisfied (52% compared with 45%) when compared to employees/ former employees/ employee representatives. Still, the proportion of employees who are extremely satisfied remains high, at 45%.
Unweighted sample bases in parenthesis
8.2 Perceptions of the information provided by Acas
The chart below shows the levels of agreement with four statements concerning the information provided by the Acas helpline. Results are positive, with more than 4 in 5 respondents agreeing with all 4 statements, and 9 in 10 (91%) agreeing that the information provided was valuable to them. Disagreement does not exceed more than 1 in 20 for any these measures.
8.2.1 Perceptions of information provided, by main call subject
The table below shows the same 4 measures but segmented by the main call subject. Those who called in relation to diversity and discrimination or discipline, dismissal or grievance were significantly less likely to be in agreement with all four statements, perhaps owing to the more sensitive or complex nature of these subject areas.
Conversely, respondents who called regarding holidays/ working time and wage-related issues were significantly more likely to be in agreement with all measures.
Table 10: Q8. Please indicate how far you agree or disagree with each of the following statements? Thinking about your call; the information provided – (% agree by main call subject)
| Base size | Answered your enquiry in full | Helped you to decide what to do next | Was valuable to you | Gave you the confidence to deal with similar issues in the future | |
|---|---|---|---|---|---|
| Absence, sickness or stress | 373 | 86% | 88% | 91% | 88% |
| Contract-related enquiry | 614 | 87% | 89% | 92% | 87% |
| Diversity and discrimination |
276 |
82% | 82% | 87% | 80% |
| Employment agency query |
34 |
91% | 88% | 97% | 97% |
| Family-friendly policies (including maternity, paternity and adoption) |
198 |
89% | 92% | 94% | 90% |
| Holidays/ working time |
347 |
90% | 92% | 94% | 90% |
| Redundancy/ lay-offs/ transfers | 690 | 86% | 87% | 91% | 84% |
| Wage-related issues |
502 |
90% | 93% | 94% | 90% |
| Discipline/ dismissal/ grievance | 1259 | 84% | 85% | 89% | 83% |
| Other | 300 | 82% | 87% | 91% | 85% |
8.3 Perceptions of Acas adviser
This table summarises the levels of agreement with a range of statements about the Acas adviser. Agreement for most statements lies at more than 9 in 10 respondents. The 2 exceptions are explaining the pros and cons of the options available to the respondent (79%) and caring about the respondent as a person (80%). It must be noted that these 2 measures saw higher proportions of respondents in the neither category (15% and 17% respectively), rather than strong levels of disagreement.
Unweighted sample base: 4,593
8.3.1 Perceptions of Acas adviser – by main call subject
The table below summarises perceptions of the Acas adviser segmented by the main call subject. Respondents who called regarding wage-related issues were more likely to agree that the Acas adviser understood their query (95% compared with 93%) and that they were knowledgeable (95% compared with 93%).
Conversely, those calling about diversity and discrimination were significantly less likely to agree that the Acas Adviser understood their query (89% compared with 93%) and presented information in a way that was easily understood (89% compared with 93%).
Table 11: Q9 Please indicate how far you agree or disagree with each of the following statements? Thinking about your call; the Acas member of staff (% agree by main call subject)
| Base size | Was Knowledgeable | Presented in an impartial way | Understood your query | Presented info so easily understood | Explained the pros and cons | Listened carefully | Cared about me as a person | |
|---|---|---|---|---|---|---|---|---|
| Absence, sickness or stress | 373 |
92% |
91% | 91% | 93% | 79% | 94% | 81% |
| Contract-related enquiry | 614 |
92% |
94% | 93% | 94% | 79% | 95% | 78% |
| Diversity and discrimination | 276 |
91%
|
91% | 89% | 89% | 76% | 93% | 77% |
| Employment agency query |
34 |
94% |
100% | 94% | 94% | 91% | 94% | 87% |
| Family-friendly policies (including maternity, paternity and adoption) |
198 |
92% |
94% | 96% | 96% | 78% | 97% | 83% |
| Holidays/ working time |
347 |
95% |
95% | 95% | 93% | 81% | 97% | 82% |
| Redundancy/ lay-offs/ transfers | 690 |
92% |
94% | 93% | 94% | 79% |
94% |
81% |
| Wage-related issues | 502 |
95% |
94% | 96% | 95% | 81% |
96% |
83% |
| Discipline/ dismissal/ grievance | 1259 |
92% |
94% | 92% | 93% | 79% | 93% | 79% |
| Other | 300 |
91% |
94% | 93% | 92% | 75% |
96% |
72% |
8.4 Length of call to Acas helpline
Encouragingly, most respondents felt that the length of the conversation with their helpline adviser was ‘just right’ (94%). Although statistically different, the vast majority of both the employees and employers thought the call length was about right – 97% of employees and managers and 94% of employees.
Those calling about diversity and discrimination and discipline/ dismissal/ grievance are less likely to feel their call length was ‘about right’ when compared to the total average (91% and 93% respectively compared with 94%), and more likely to feel that the call was too short (8% and 7% respectively compared with 5%).
There may be a correlation between these findings and respondents feeling that these types of enquiries were not answered in full, and that the information provided did not help them in their decision on what to do next (discussed in section 8.2.) However, it is worth noting that while these differences are statistically significant, more than 9 in 10 respondents with these enquires still felt that the duration of their call was just right.
Those calling about holidays / working time are significantly more likely to feel that their call duration was ‘about right’ (98% compared with 94%). Here too, a correlation emerges between this finding and respondents feeling their enquiry was answered in full and helped them decide what to do next. This may be indicative of enquiries of this nature being more generic and less complex in comparison to those related to dismissals and discrimination.
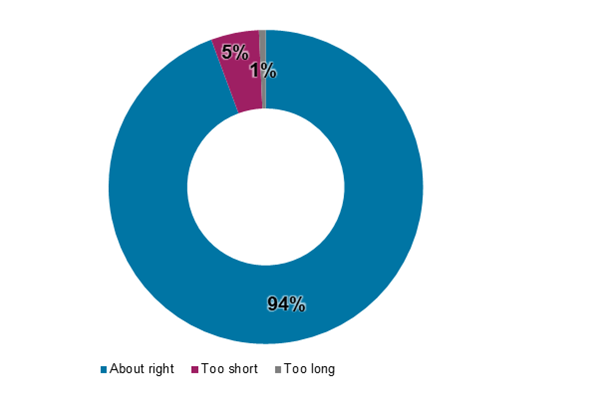
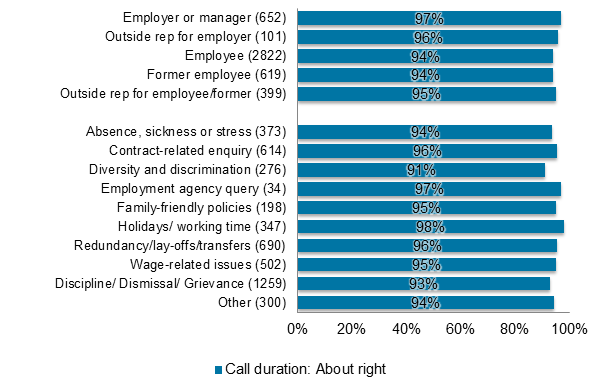
Unweighted sample base: 4,593
8.5 Information received throughout the call
Respondents were asked whether they received an offer of additional information or services throughout their call with the Acas adviser. Around half of all respondents affirmed that their adviser mentioned deadlines relevant to their situation (46%) and offered to send an email with relevant information (55%). 1 in 8 (12%) affirmed that they were offered a call-back.
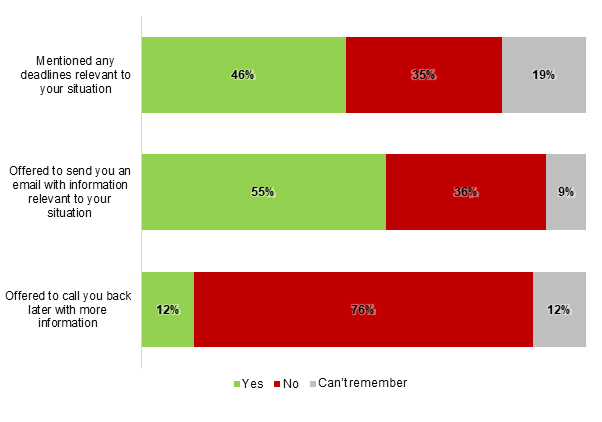
8.5.1 Information received – by main call subject
Respondents calling about subjects surrounding diversity and discrimination were significantly more likely to affirm that their Acas adviser mentioned deadlines (61% compared with 46%) and that they were offered an email with content relevant to their query (68% compared with 55%).
The same can be said for those calling about discipline/ dismissal/ grievance with 51% compared with 46% and 58% compared with 55% respectively. It must be noted that respondents who called concerning these subjects respectively, were significantly less likely to agree that their query was answered in full.
Table 12: Q14 To the best of your recollection, which of these did the adviser do during your call? (% yes by main call subject)
| Base size | Mentioned deadlines | Emailed with relevant information | Offered call-back | |
|---|---|---|---|---|
| Absence, sickness or stress | 373 | 34% | 45% | 8% |
| Contract-related enquiry | 614 | 37% | 49% | 8% |
| Diversity and discrimination |
276 |
64% | 68% | 15% |
| Employment agency query |
34 |
53% | 44% | 3% |
| Family-friendly policies (including maternity, paternity and adoption) |
198 |
36% | 46% | 5% |
| Holidays/ working time |
347 |
41% | 57% | 12% |
| Redundancy/ lay-offs/ transfers |
690
|
45% | 55% | 11% |
| Wage-related issues |
502 |
61% | 67% | 24% |
| Discipline/ dismissal/ grievance | 1,259 | 51% | 58% | 13% |
| Other | 300 | 35% | 39% | 7% |
8.6 Net Promoter Score
Another key measure of overall perceptions is a users' willingness, or otherwise, to recommend a service provider. In the figure below, a net promoter score (NPS) is calculated from the proportion who give a score of 9 or 10 - ‘promoters’ who are very likely to recommend the service provider – minus those less likely (‘detractors’ who score 0-6). With 78% classified as promoters and 8% as detractors, this yields an NPS of +70.
This is a very good net promoter score and reinforces that generally users are satisfied with the services provided by Acas. This is also a strong indication that users are likely to recommend and speak positively of Acas’ services based on the experience they had.
When segmented by employers/employer representatives and employees/former employees/employee representatives, the NPS scores are +77 and +68 respectively.
While the NPS score for employers/employer representatives is significantly higher, both scores are positive and indicate a strong likelihood to recommend the service.
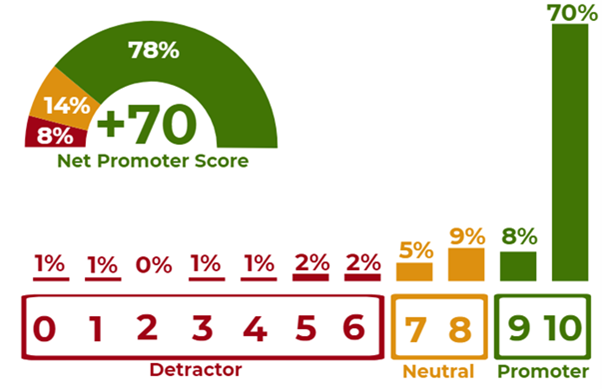
8.7 Perceptions of effort made to answer query
Respondents were asked to rate on a scale of 1-5, with 1 being little effort and 5 being much effort, how much effort they made to get their query answered by the helpline. Almost half of respondents (45%) felt that they went to little effort to get their query answered, with 1 in 3 giving the lowest effort rating (29%).
Conversely, a third of respondents (34%) felt that they went to much effort to get their query answered, with 1 in 5 (20%) giving the highest effort rating.
The chart below shows the relationship between those who felt that they went to much effort (giving a score of 4 or 5) to get their query answered and the main subject of their query. Those calling about discipline/ dismissal/ grievance were significantly more likely to feel they went to much effort to get their query answered, whereas those calling about wage-related issues were significantly less likely.
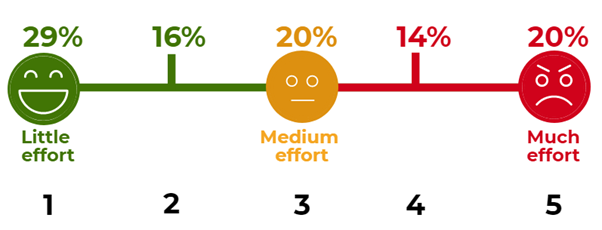
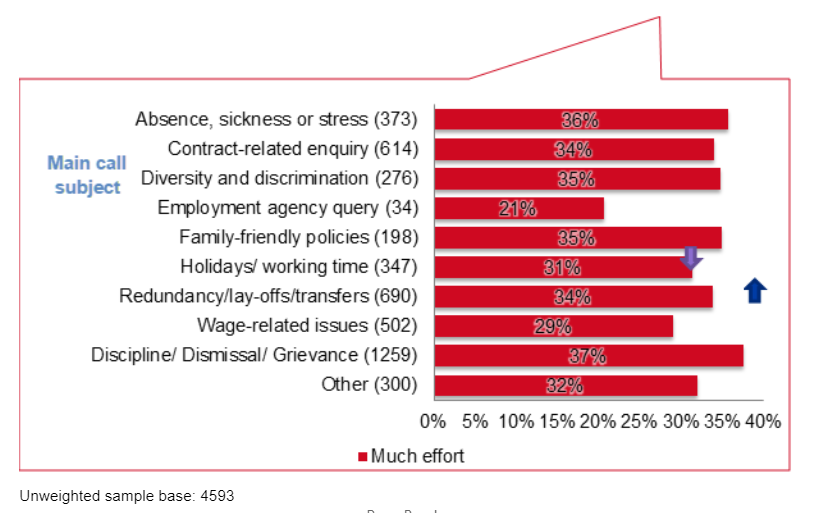
8.7.1 Perceptions of effort made to answer query – by subgroup
The chart below shows the percentage of respondents giving a rating of 4 or 5 for this question, segmented by number of call attempts and time taken for the call to be answered. Respondents who made more than one call attempt to the Acas helpline were significantly more likely to feel that they went to much effort to get their query answered: 42% of those making 2 to 3 attempts and 46% of those making 4 to 5 attempts (compared with a 34% total average).
The length of time for a respondent’s call to be answered also has an impact on their perceptions of the effort made to get their query answered. Respondents whose calls were answered in over 3 to 5 minutes were significantly more likely to feel that they went to much effort to get their query answered by the Acas helpline (38% compared with 34%), as were those where it took over 10 to 20 minutes for their call to be answered (45% compared with 34%). Employees were also significantly more likely than other groups to feel that they went to much effort to get their query resolved.
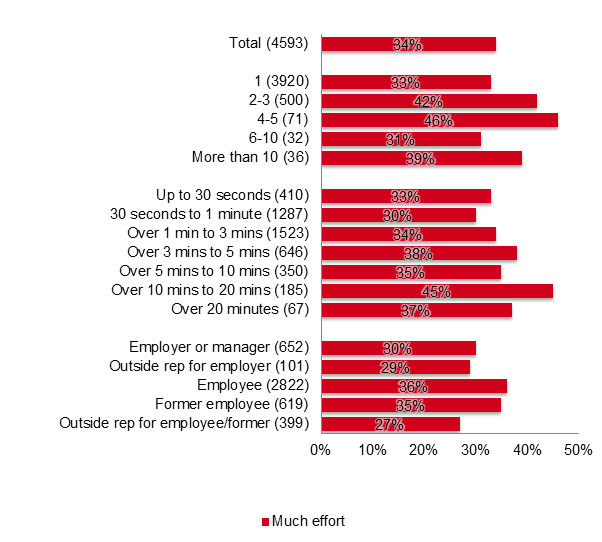
Unweighted sample base in parenthesis
8.7.2 Perceptions made to get query answered – by overall satisfaction
The chart below shows the relationship between those who feel that they went to much effort to get their query resolved and levels of overall satisfaction with the Acas helpline service. Respondents who are dissatisfied with the overall service are significantly more likely to feel that they went to much effort, with over two-thirds of dissatisfied respondents feeling this way (65%, compared with 33% of those satisfied).
As levels of dissatisfaction with overall service increase, so does the proportion of respondents who feel they went to much effort to get their enquiry answered, reaching 91% for those very dissatisfied with the overall service.
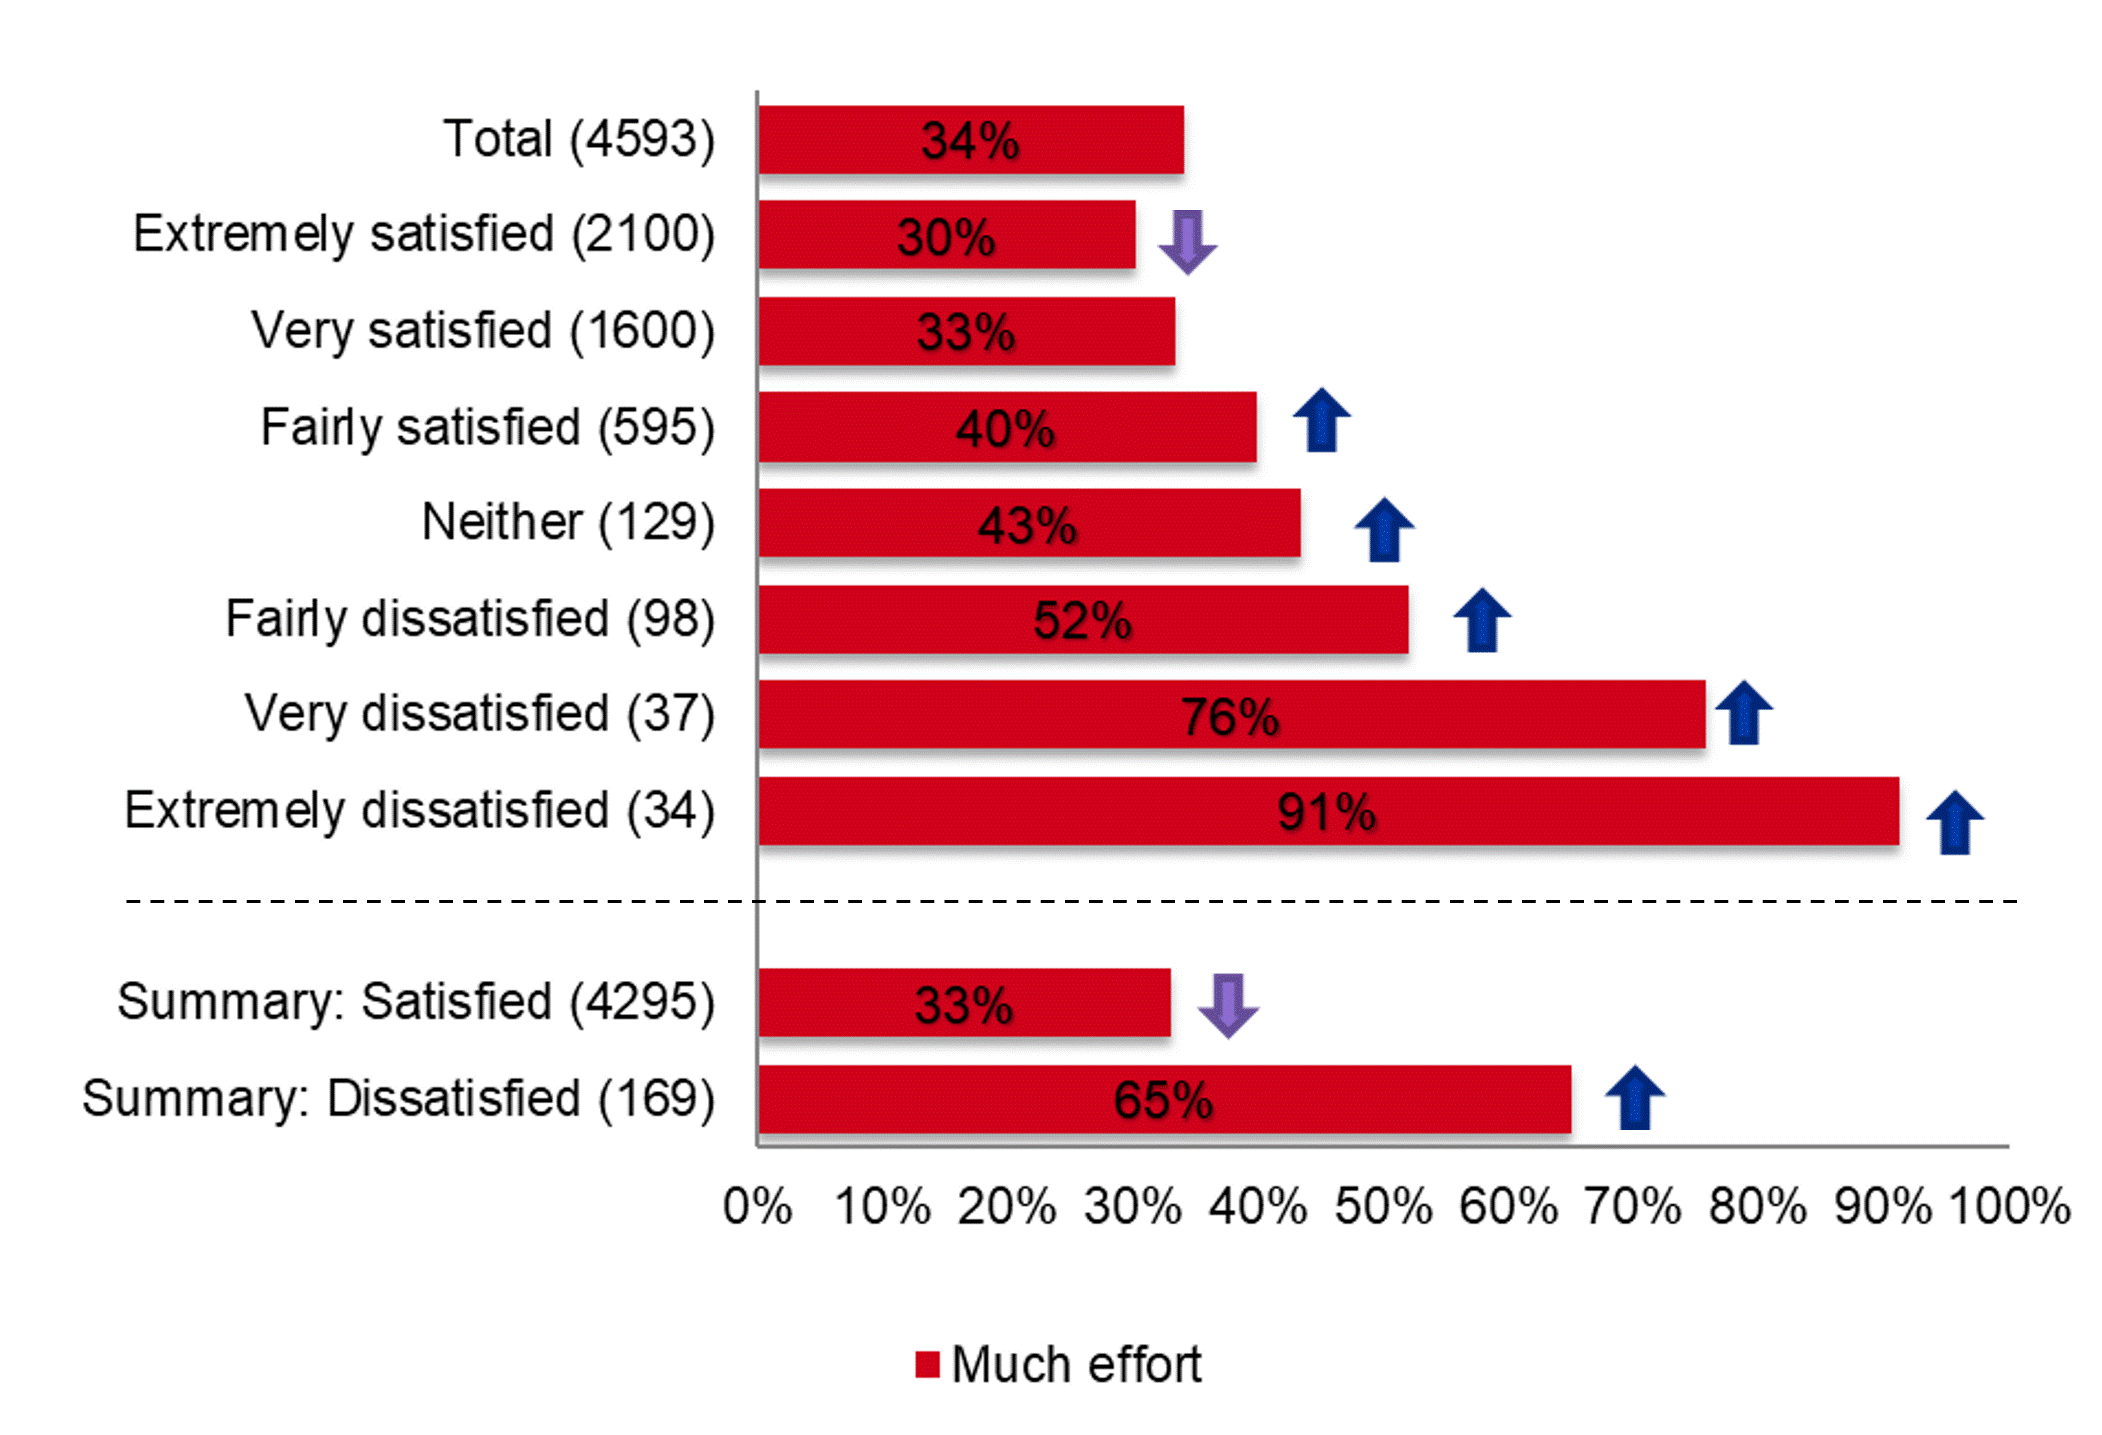
Unweighted sample base: 4,593
8.8 Perceptions of effort made by Acas
Respondents were again asked to rate on a scale of 1 to 5, with 1 being little effort and 5 being much effort, how much effort they perceive Acas went to in order to answer their query. Encouragingly, two thirds of respondents (67%) feel that Acas went to much effort to answer their query, with 2 in 5 (40%) giving the highest effort rating. Less than 1 in 10 (8%) feel that Acas went to the lowest level of effort to answer their query.
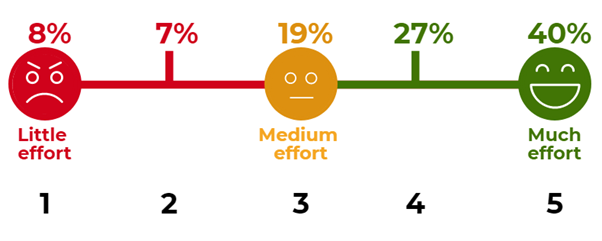
9. Appendix: Statement of terms
Compliance with International Standards
BMG complies with the International Standard for quality management systems requirements (ISO 9001:2015) and the International Standard for market, opinion and social research service requirements (ISO 20252:2012) and the International Standard for information security management (ISO 27001:2013).
Interpretation and publication of results
The interpretation of the results as reported in this document pertain to the research problem and are supported by the empirical findings of this research project and, where applicable, by other data. These interpretations and recommendations are based on empirical findings and are distinguishable from personal views and opinions.
BMG will not publish any part of these results without the written and informed consent of the client.
Ethical practice
BMG promotes ethical practice in research: we conduct our work responsibly and in light of the legal and moral codes of society.
We have a responsibility to maintain high scientific standards in the methods employed in the collection and dissemination of data, in the impartial assessment and dissemination of findings and in the maintenance of standards commensurate with professional integrity.
We recognise we have a duty of care to all those undertaking and participating in research and strive to protect subjects from undue harm arising as a consequence of their participation in research. This requires that subjects’ participation should be as fully informed as possible and no group should be disadvantaged by routinely being excluded from consideration. All adequate steps shall be taken by both agency and client to ensure that the identity of each respondent participating in the research is protected.
With more than 25 years’ experience, BMG Research has established a strong reputation for delivering high quality research and consultancy.
BMG serves both the public and the private sector, providing market and customer insight which is vital in the development of plans, the support of campaigns and the evaluation of performance.
Innovation and development is very much at the heart of our business, and considerable attention is paid to the utilisation of the most up to date technologies and information systems to ensure that market and customer intelligence is widely shared.