
Executive summary
Introduction and background
The Acas helpline provides free and confidential advice to employers, employees and their representatives on employment rights, best practice and policies, and resolving workplace conflict. 644,000 calls were handled by the helpline during the 2021 to 2022 operational year (1 April 2021 to 31 March 2022).
The purpose of this survey is to evaluate the quality and effectiveness of the helpline service, to ensure that this service continues to meet the needs of Acas's customers.
This report is based on data collected via questionnaires completed by Acas helpline callers using an online survey which is emailed to those taking part in the survey, during the 2021 to 2022 operational year.
Management of the survey and this report is written by Acas's research, analysis and insight (RAI) team. This team is made up of government social researchers and government statisticians.
Who is using the Acas helpline?
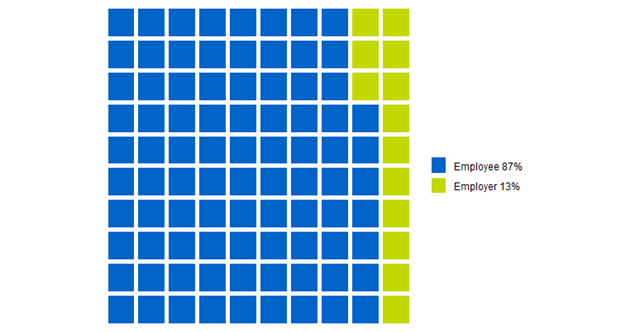
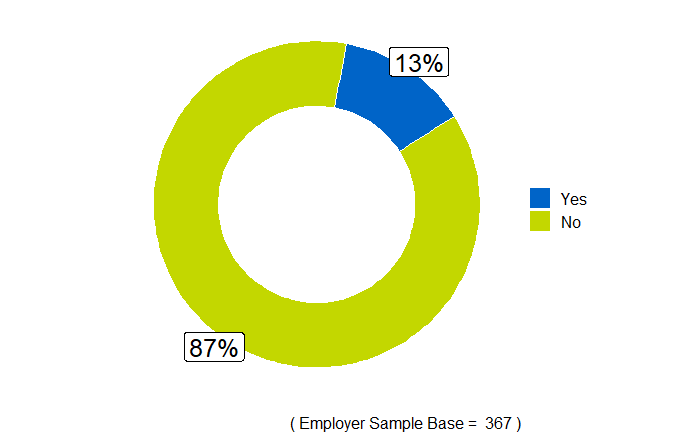
In total, 2,738 respondents completed the Acas helpline survey. The majority of respondents had called the helpline as an employee, former employee or on behalf of an employee or former employee ('employees' group) (87%), while 13% were calling as an employer or manager, or on behalf of an employer or manager ('employers' group).
80% of employee respondents were either in full-time or part-time employment. Employers were significantly more likely to work in the private sector (62% compared with 49% of employees) or the voluntary and not-for-profit sector (13% compared with 5% employees). Conversely, employees were significantly more likely to work in the public sector (34% compared with 21% of employers).
This report defines small and medium-sized enterprises (SMEs) as encompassing micro (fewer than 10 employees), small (10 to 49 employees) and medium-sized (50 to 249 employees) enterprises. Large enterprises are those above 250 employees.
Overall the respondents were more likely to be calling from large enterprises (30%) rather than micro (21%), small (21%) or medium-sized enterprises (16%). Interestingly, employers (82%) were significantly more likely to be calling from SMEs compared to employees (54%). Contrarily, employees (32%) were significantly more likely to state they were from large enterprises than employers (15%). 46% of employer respondents stated their workplace had an HR or personnel department and only 19% of employees were members of a trade union.
During the 2021 to 2022 operational year, calls related to the human health and social work activities industry were the highest for both employees (19%) and employers (16%). This may be expected considering the additional pressures put on this industry during the covid-19 (coronavirus) pandemic.
Respondents came from a variety of occupations. For employees, most were within "administrative and secretarial occupations" (21%) and secondly those in "professional occupations" (13%). For employers, most were "managers, directors and senior officials" (45%) followed by "administrative and secretarial occupations" (24%).
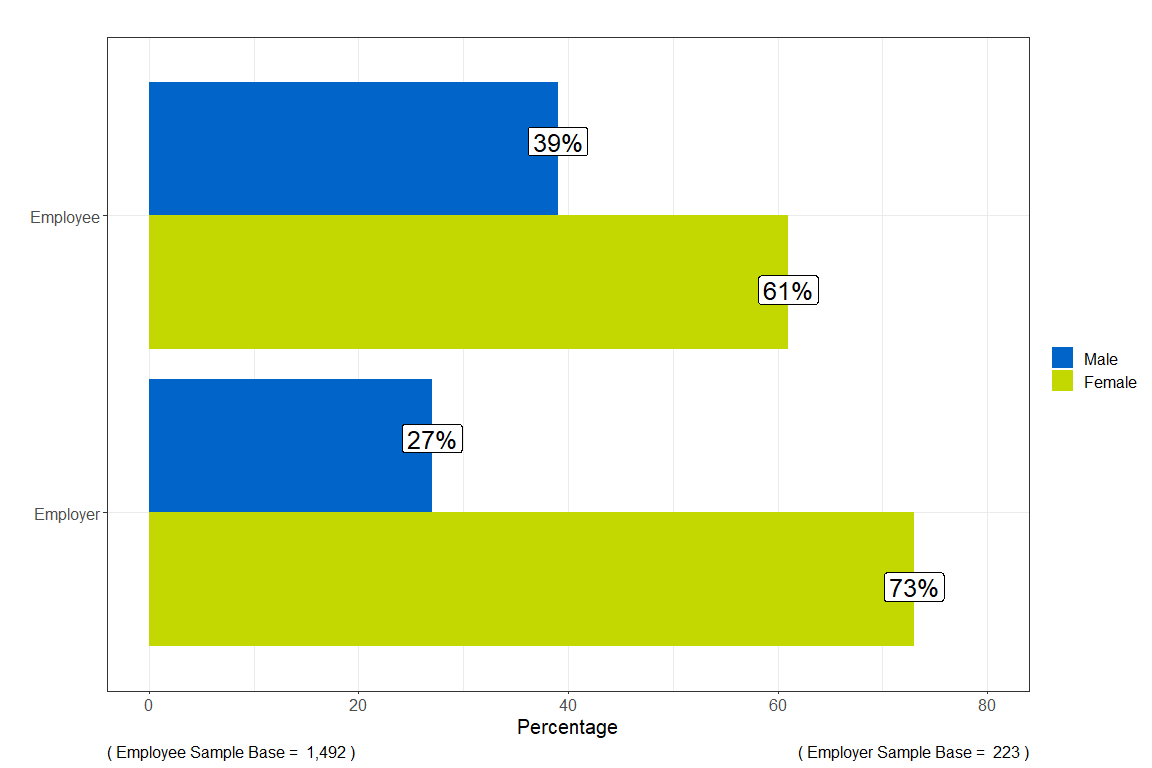
Of the 1,715 respondents who disclosed their sex, most employees and employers calling the helpline were female (61% and 73% respectively). The mean age of respondents was 48 years and over 8 in 10 (81%) identified as being from a white ethnic background. Nearly a third of respondents (32%) identified as having a long-term health problem, illness, or a disability.
Journey to the helpline
Encouragingly, one third of respondents became aware of the helpline through a recommendation from a friend or family member (33%). The second most popular response was that respondents found out about the helpline through the Acas website (23%).
Just below half of the respondents (45%) visited the Acas website before calling and 35% had discussed the issue with their management, employee(s) or HR prior to their call. Employers were significantly more likely to have visited the Acas website (60% compared with 43% of employees) before calling the helpline.
Of the 55% who did not visit the Acas website, 42% of employees and 36% of employers stated it was because they preferred to speak to an adviser. The free text responses for not visiting the website included that the lack of British Sign Language videos on the Acas website meant they could not access the information.
Furthermore, nearly half of respondents (49%) called the helpline after visiting the Acas website because they only found partial answers to their question or they needed more information. Of the respondents who called the helpline because they did not find any of the information they needed on the website, over 60% were discussing an issue involving either a discipline, dismissal and grievance or a contracts subject.
Accessing the helpline
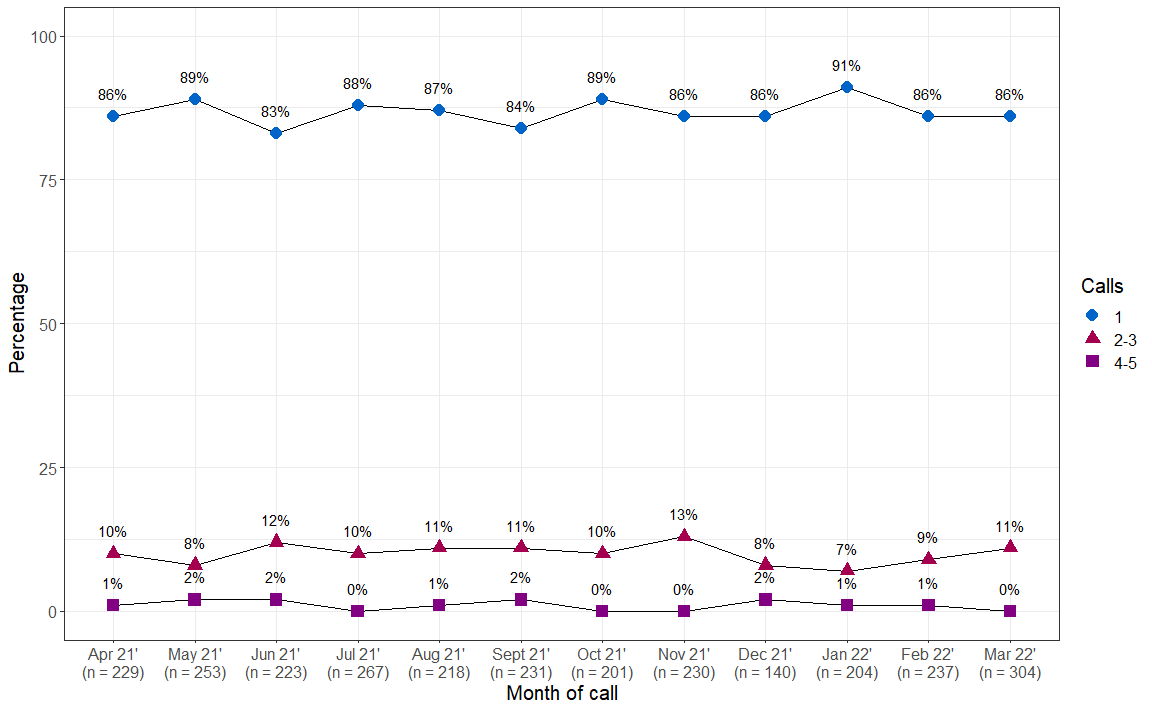
The helpline was shown to be easily contactable with respondents stating 87% of the time that they reached the helpline on their first call attempt. A further 10% stated that they called the helpline 2 to 3 times before getting through to an adviser. Reaching the helpline on the first call attempt ranged from 91% in January 2022 to 83% in June 2021.
Additionally, upon reaching the helpline, more than 19 in 20 (96%) respondents were satisfied (either extremely, very or fairly) with the length of time to answer their call.
Reason for the call
Overall, the most common topics covered were discussing either a discipline, dismissal and grievance (35%) or a contracts subject (30%). These were the most common subjects for both employees and employers. However, the subject of highest frequency was reversed, with employees stating discipline, dismissal and grievance (36%) and employers responding with contracts (32%).
It should be advised that the subjects chosen are the perceived subjects by the respondent and different respondents may have different interpretations or understanding of the subject matter.
Respondents were most frequently calling to discuss contracts in the early stages of dispute resolution (information request and informal action) compared to a discipline, dismissal and grievance issue in the latter stages (formal action and employment tribunal). The different stages of dispute resolution are discussed further later in the report.
Respondents were asked the extent to which they agreed or disagreed their enquiry was stressful, urgent and complex. Overall, there was a high level of agreement with each of these statements (84% stressful, 82% urgent and 73% complex).
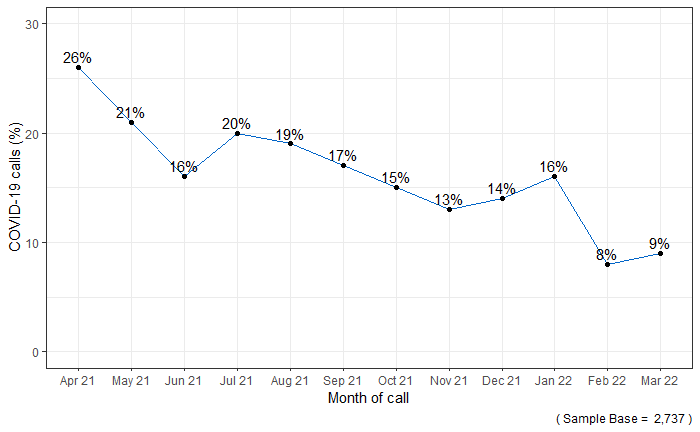
16% of calls to the helpline related to covid. These calls peaked at 26% of respondent calls during April 2021. The Coronavirus Job Retention Scheme (CJRS), where an employer could claim a percentage of a furloughed employee's or worker's wages, ended on 30 September 2021.
Despite the scheme ending, respondents continued to state they had been furloughed when they rang the helpline past this date. This may be the respondents interpreting the question as they were calling about a subject when they were on the furlough scheme. 11% of total respondents stated they were furloughed when contacting the helpline and this peaked at 22% during April 2021.
The "human health and social work activities" industry was the most frequent category noted (21%) when the helpline call involved discussing a covid issue.
Both employees and employers were asked about the potential workplace problems when normal business resumes and lockdown eases or ends. Employees raised the potential issues surrounding:
- employment working patterns or hours
- organisations following correct guidance for the office environment
- job losses
- mental health implications
- vaccination status
While employers stated themes on potential problems including:
- flexible working or working patterns
- employees not wanting to return to the office
- health and safety in the office environment
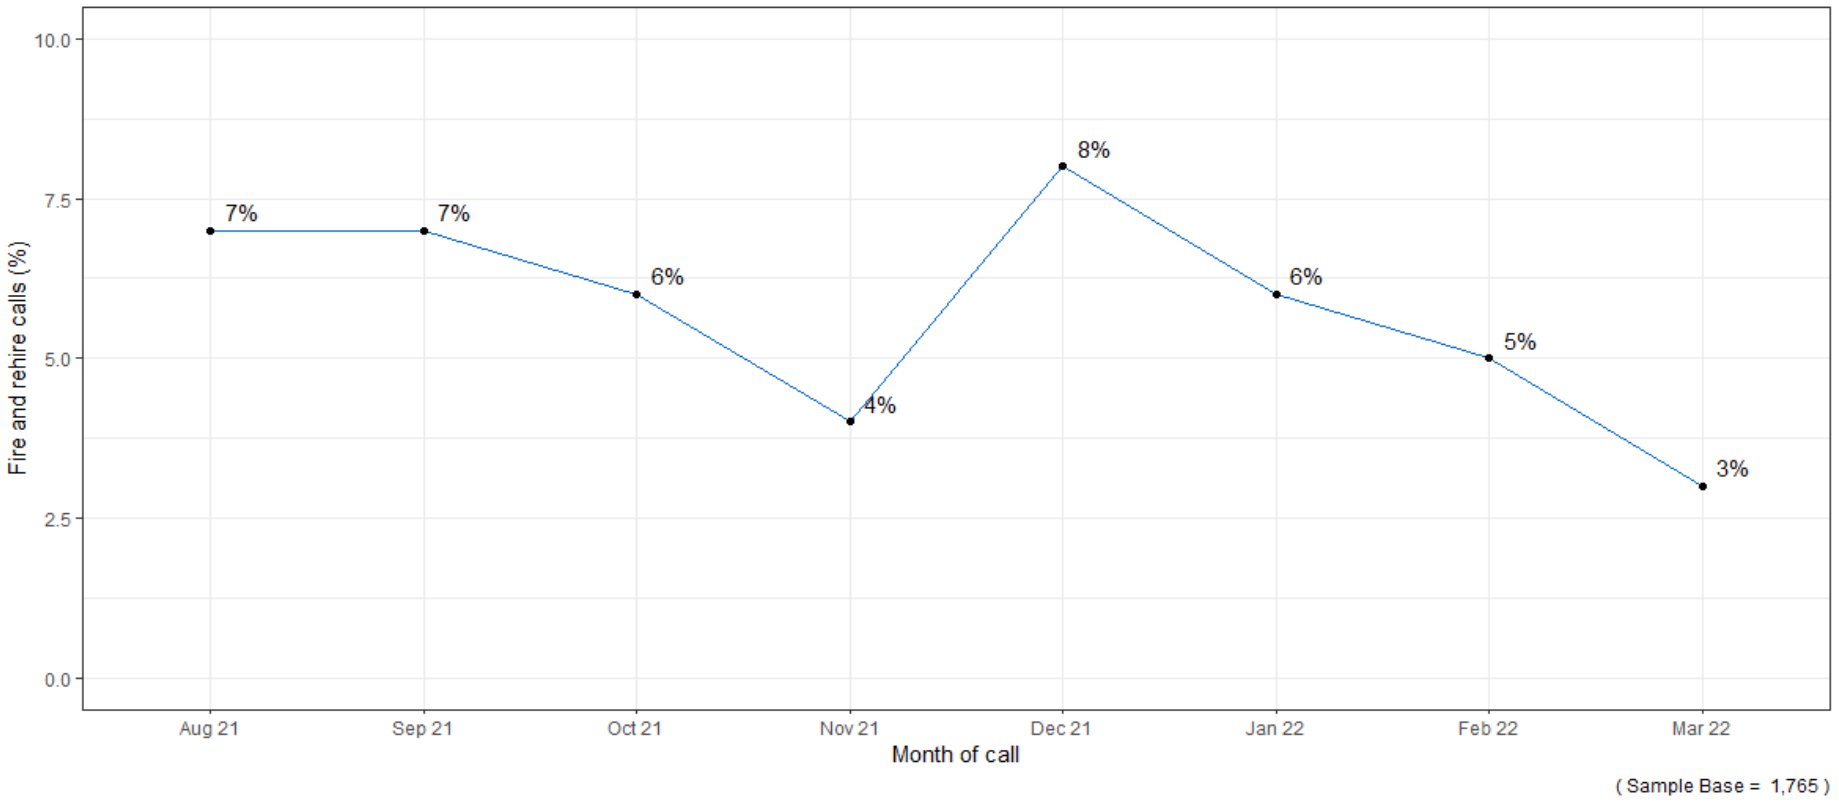
The respondents were asked about the practice named "dismissal and re-engagement". This is sometimes known as 'fire and rehire' or 'dismiss and rehire'. This question was added to the helpline survey in August 2021 and therefore any figures relate to responses to calls made during the period August 2021 to March 2022.
5% of respondents stated the call to the helpline related to the practice of fire and rehire during the period August 2021 to March 2022. These calls peaked at 8% during December 2021. Similar to the overall and covid picture, respondents were most frequently from the human health and social work activities industry for fire and rehire calls, at nearly 1 in 5 (19%).
Experience of the helpline
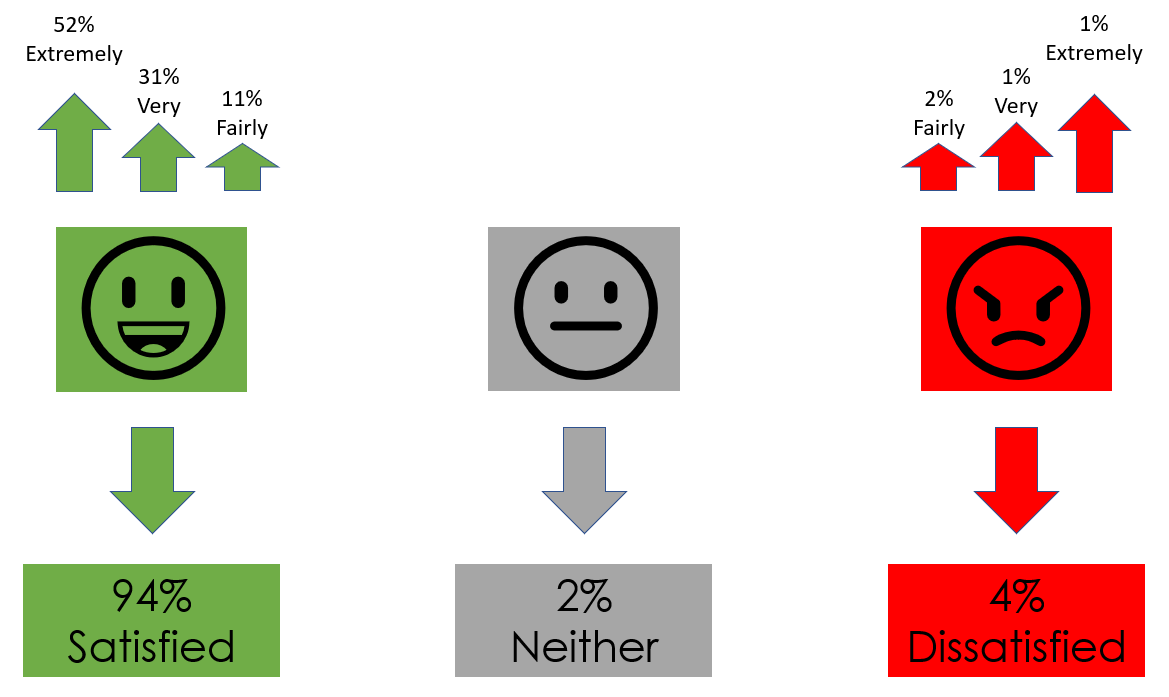
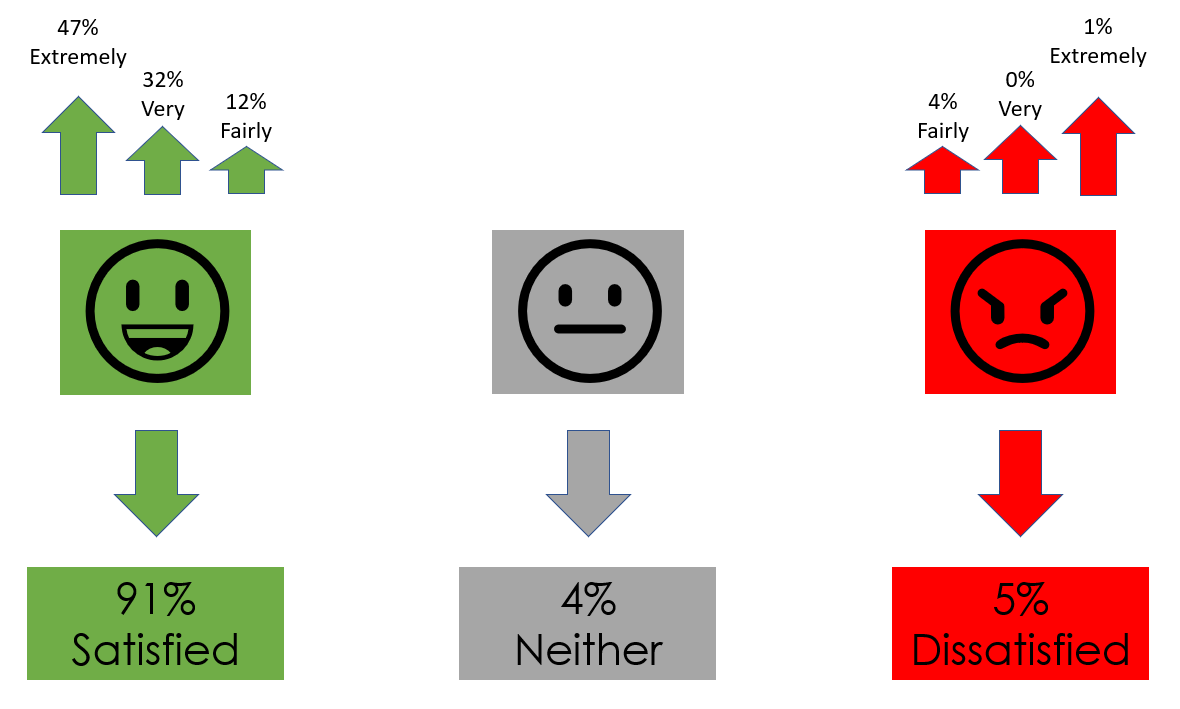
The helpline performed extremely well when respondents reviewed their customer service. Overall, more than 9 in 10 (94%) respondents were satisfied with the helpline service, with over half (52%) feeling extremely satisfied.
Satisfaction remained high for covid-related calls (91%) compared to 95% satisfaction for calls which were not related to this subject. However, the satisfaction levels were lower for calls relating to fire and rehire, (86%) compared to 95% satisfaction for calls which were not related to this subject. It should be noted, due to the small sample size of fire and rehire calls, any comparisons should be treated with some caution.
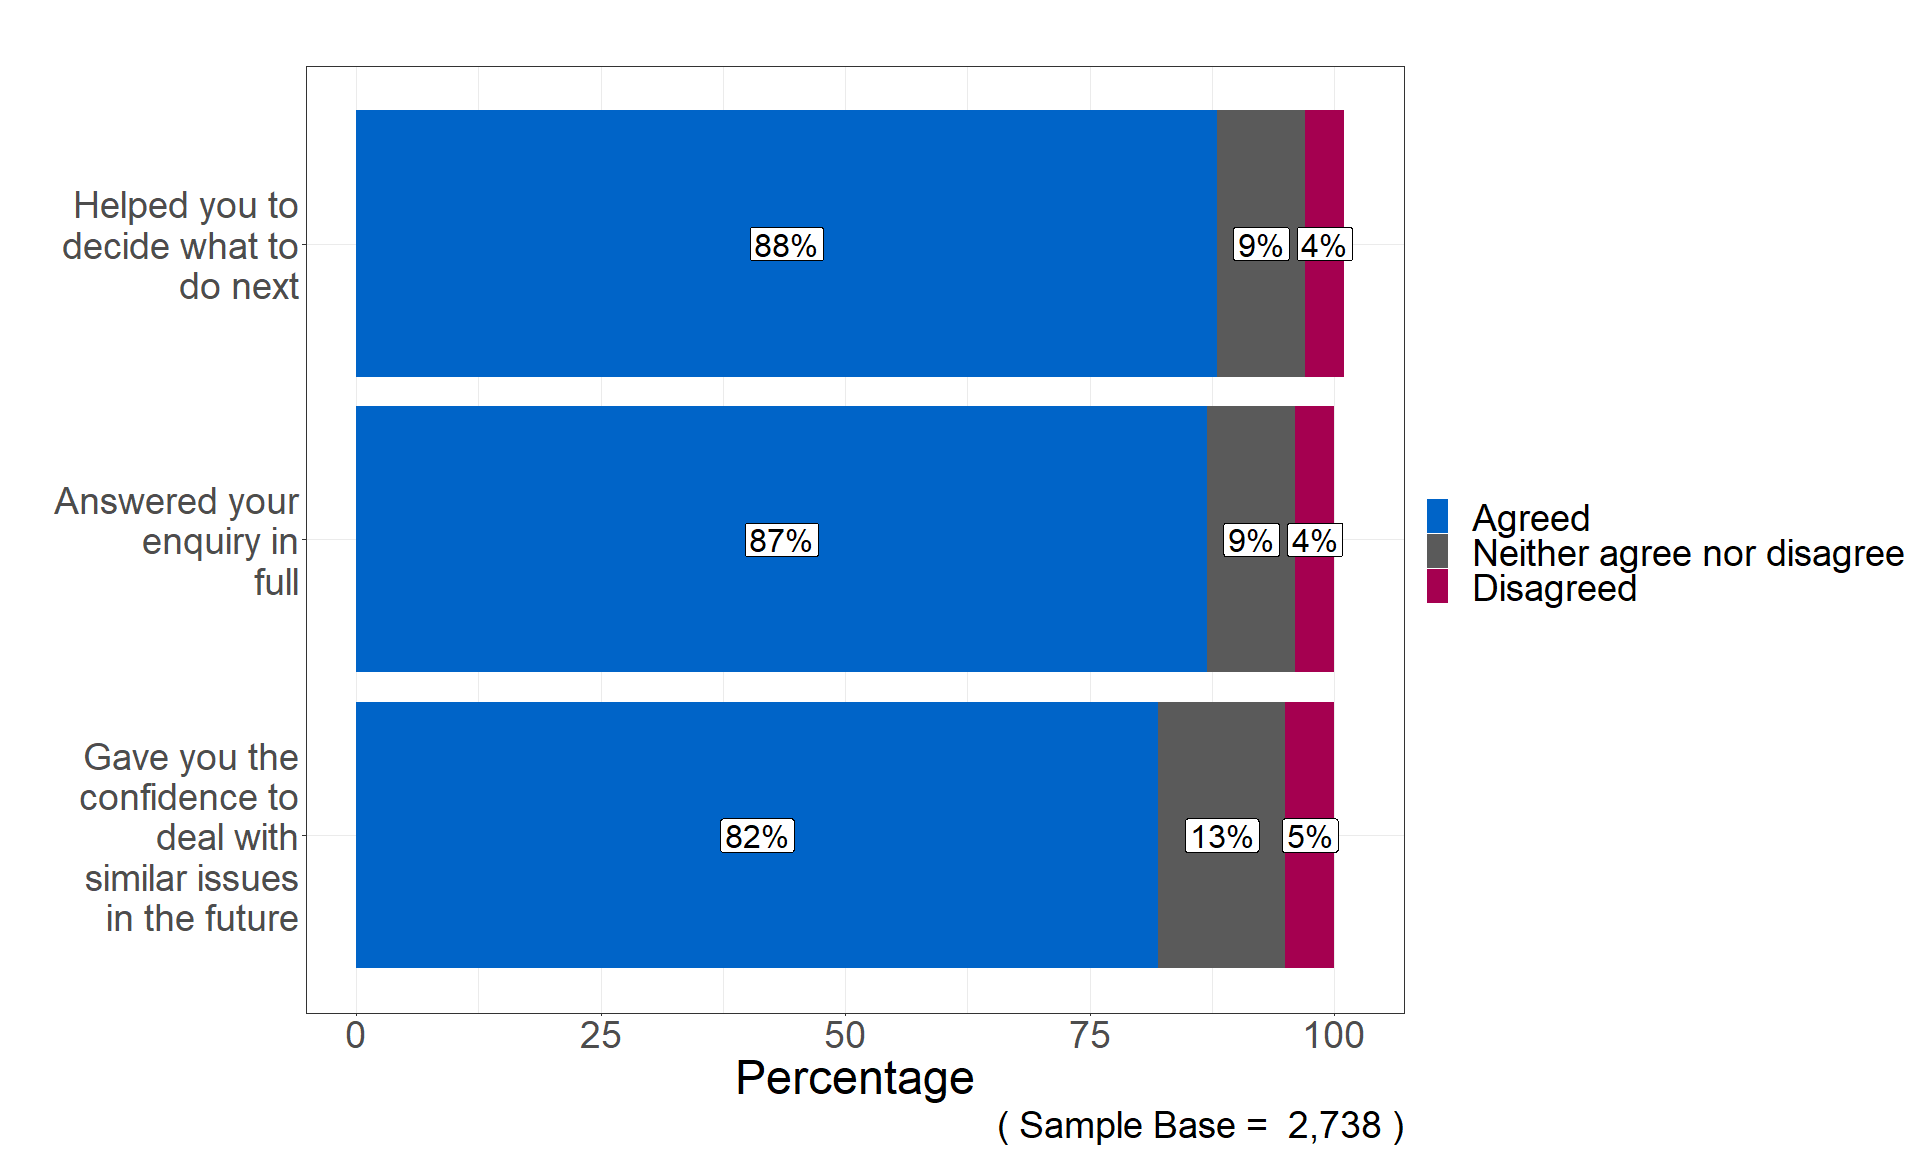
Acas's key performance indicator (KPI) for the helpline during the 2021 to 2022 operational year was for 85% of users to be able to take clear action following their call to the helpline. This was measured by asking respondents if the information provided helped them decide what to do next.
Overall, this target was successfully met as 88% agreed that the information provided by the adviser helped them decide what to do next for their query. This was slightly lower at 87% for covid calls but still above the 85% target.
However, the KPI target of 85% was not met when the call was discussing fire and rehire as respondents stating the information provided "helped them decide what to do next" had a lower agreement level of 77%. It should be noted, due to the small sample size of fire and rehire calls, any comparisons should be treated with some caution.
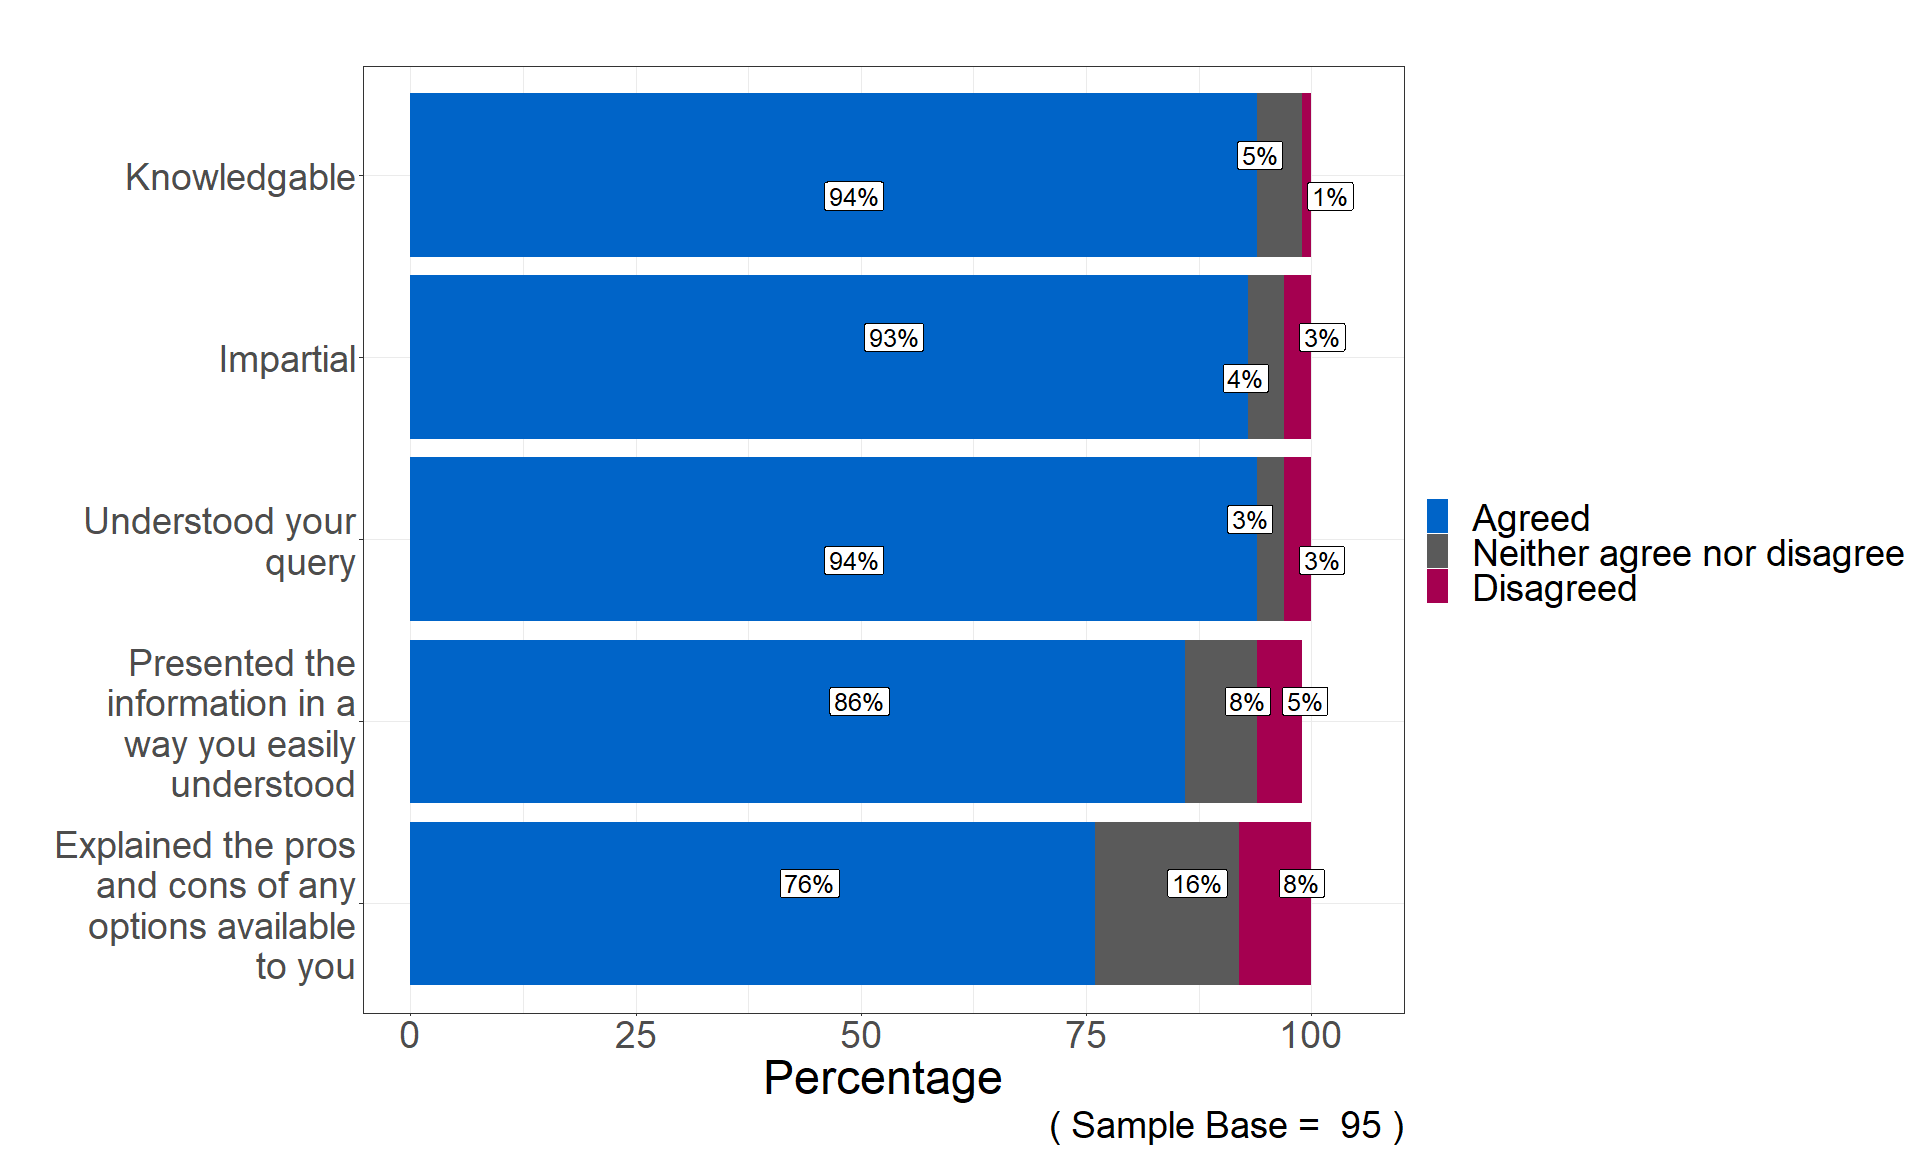
The respondents' perceptions of the Acas member of staff were very positive. Overall, respondents agreed the Acas member of staff:
- presented the information in an impartial way (95%)
- was knowledgeable (94%)
- understood their query (93%)
- presented the information in a way they easily understood (93%)
These levels remained high for covid and fire and rehire calls.
However, there was an overall lower agreement level when asked if the adviser had explained the pros and cons of any options available (80%), with 14% stating they "neither agree nor disagree" and 5% disagreeing with this statement.
These lower levels of agreement on explaining the pros and cons of any options available were mirrored when the call related to covid (77%) and fire and rehire (76%). This lower level of agreement may partly be due to some helpline calls not requiring a discussion of the pros and cons of the advice given.
Call outcomes and next steps
A further positive result from the survey was that the advice given by the helpline provided information which helped 88% of respondents to take some form of action. The most frequent response was discussing the problem with management, employee(s) or HR, with 38% of respondents taking this action. Employers (47%) were significantly more likely to have taken this action than employees (36%).
Around 1 in 10 (11%) of all respondents called the helpline again. Employees (12%) were significantly more likely to call the helpline again compared to employers (5%).
Of those who sought additional advice, the most common source was a lawyer or solicitor, cited by 42% of respondents.
Over 4 in 10 respondents (46%) who sought additional advice or assistance from another body did so on the recommendation of the helpline adviser. Only 2% of those who sought additional advice did so because they did not understand the information or advice given by the Acas adviser.
More than a third (35%) of employee respondents had been thinking about making a claim to the employment tribunal (or submitting an early conciliation notification of a claim to Acas) before calling the helpline. At the time of completing the survey, 84% of employees stated that they had not yet made a claim to the employment tribunal or submitted an early conciliation notification of a claim to Acas (although 47% of those were thinking about doing so). 52% of employee respondents felt the helpline was very important in helping them decide whether to make a claim.
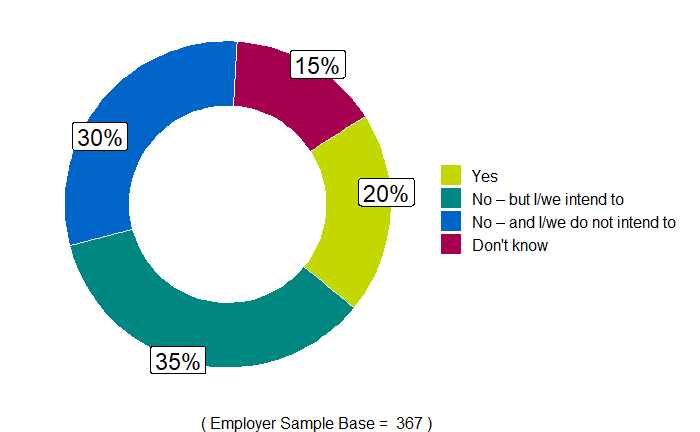
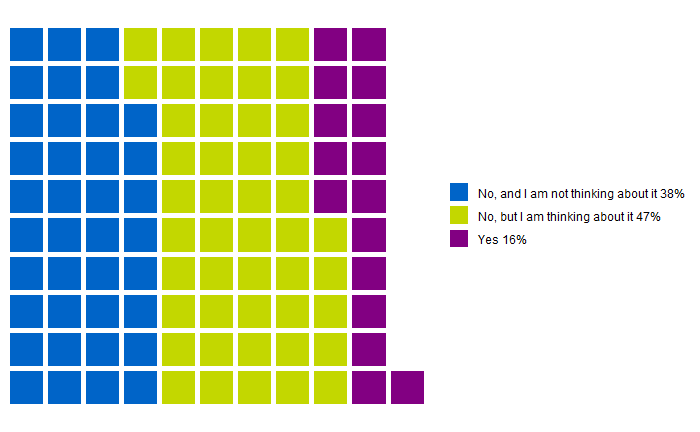
55% of employers have, or intend to, update or introduce any policies or procedures as a result of their call to the helpline. Additionally, 72% of employers concerned with a possible tribunal situation felt the helpline was very useful in helping them deal with the issue.
Introduction and background
Background and objectives
The Acas helpline provides free and confidential advice to employers, employees and their representatives on employment rights, best practice and policies, and resolving workplace conflict. 644,000 calls were handled by the helpline during the operating year 2021 to 2022.
The purpose of this survey is to evaluate the quality and effectiveness of the helpline service, to ensure that this service continues to meet the needs of Acas's customers.
This report is based on data collected via questionnaires completed by Acas helpline callers using an online survey which is emailed to those taking part in the survey, during the 2021 to 2022 operational year (1 April 2021 to 31 March 2022).
The survey was managed and this report was written by Acas's research, analysis and insight (RAI) team. This team is made up of government social researchers and government statisticians.
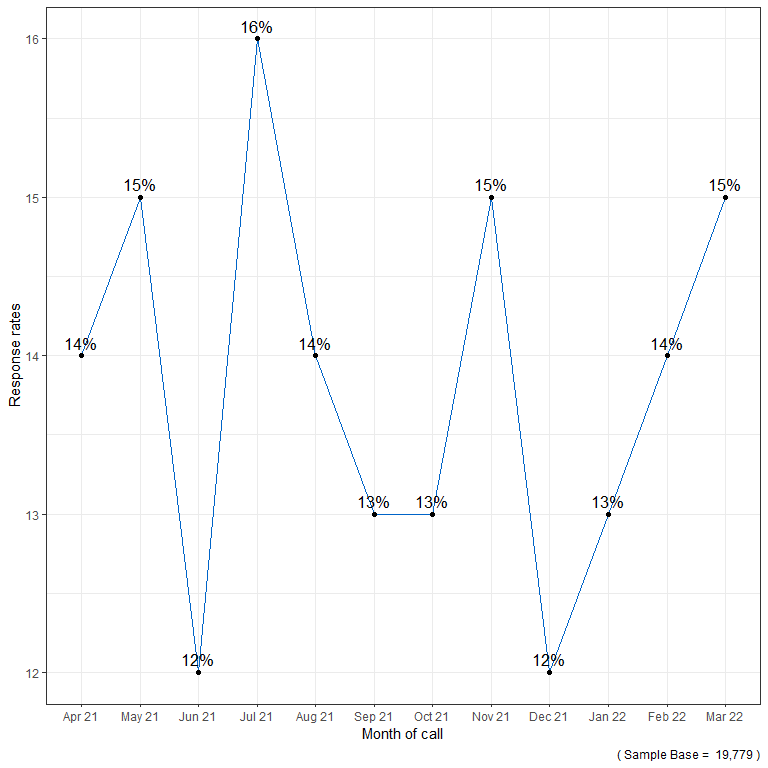
The highest response rate was in July 2021 when 16% of callers who were invited to participate completed the survey. The lowest response rates occurred in June 2021 and December 2021 when 12% responded to the survey request.
Reporting conventions
Throughout this report, the term 'significant' is only used to describe differences within particular groups (for example caller type) that are statistically significant. Statistical significance denotes if the difference between 2 variables is likely to be due to real difference or by chance. When a difference is 'statistically significant' it is likely that the difference is not due to chance alone. Results should be treated as indicative if the base numbers of responses are particularly low.
Figures, tables and graphics are used in the report to assist analysis and explanation. There may be anomalies due to rounding differences, these are never more than plus or minus 1%.
Throughout the report, unless specifically stated otherwise, an "employee" denotes an employee, a former employee, someone calling on behalf of an employee or former employee. An "employer" represents an employer or manager, calling on behalf of an organisation or its staff, or an outside representative calling on behalf of an employer.
Who is using the Acas helpline?
The following section breaks down the key characteristics of the respondents according to their employment characteristics and caller demographics.
8% of respondents were calling the Acas helpline on behalf of a third party. These respondents were asked about the job characteristics of the person they were calling on behalf of, but questions on personal demographics were asking about the caller themselves. The term 'respondent' is used in this section to include third parties who the call was being made on behalf of.
Caller type
Respondents were asked whether they were calling as an employee, former employee, or on behalf of one of those; or as an employer or manager or on behalf of an employer. Overall, 87% of respondents were calling as employees (63%), former employees (15%) or on behalf of employees (9%), while 13% were calling as an employer or manager of their organisation (12%) or as an outside representative on behalf of an employer (1%).
Employment status
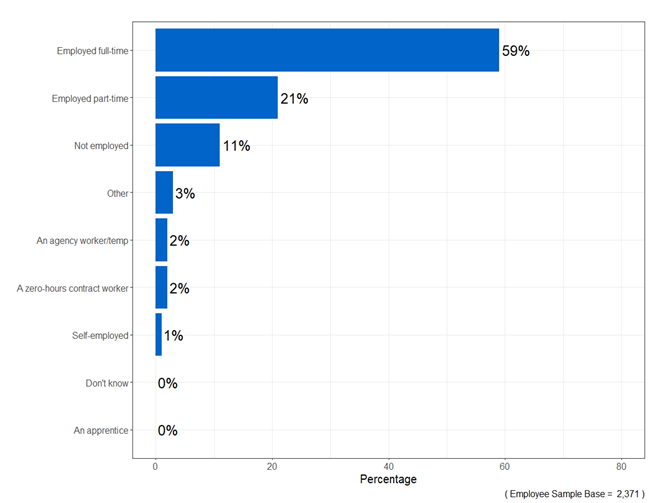
Employee respondents were asked to disclose their employment status or the employment status of the person who they were calling on behalf of. Of the 2,371 employee respondents, almost 6 in 10 respondents (59%) were in full-time employment, with a further 21% in part-time employment. 11% were unemployed and only 3% or less were self-employed, agency workers, temporary workers, zero-hours workers or other employment.
Workplace sector
Over half (51%) of the respondents stated that they were calling regarding an organisation in the private sector, with 32% working in the public sector and 6% in the not-for-profit or voluntary sector. 10% did not know the sector of the organisation they were calling about.
Employers were significantly more likely to work in the private sector (62% compared with 49% of employees) or the voluntary and not-for-profit sector (13% compared with 5% employees). Conversely, employees were significantly more likely to work in the public sector (34% compared with 21% of employers).
Size of organisation
The helpline survey asks respondents the approximate number of employees working for the organisation they were calling about. This report defines small and medium enterprises (SMEs) as encompassing micro (fewer than 10 employees), small (10 to 49 employees) and medium-sized (50 to 249 employees) enterprises. Whilst large enterprises are those above 250 employees.
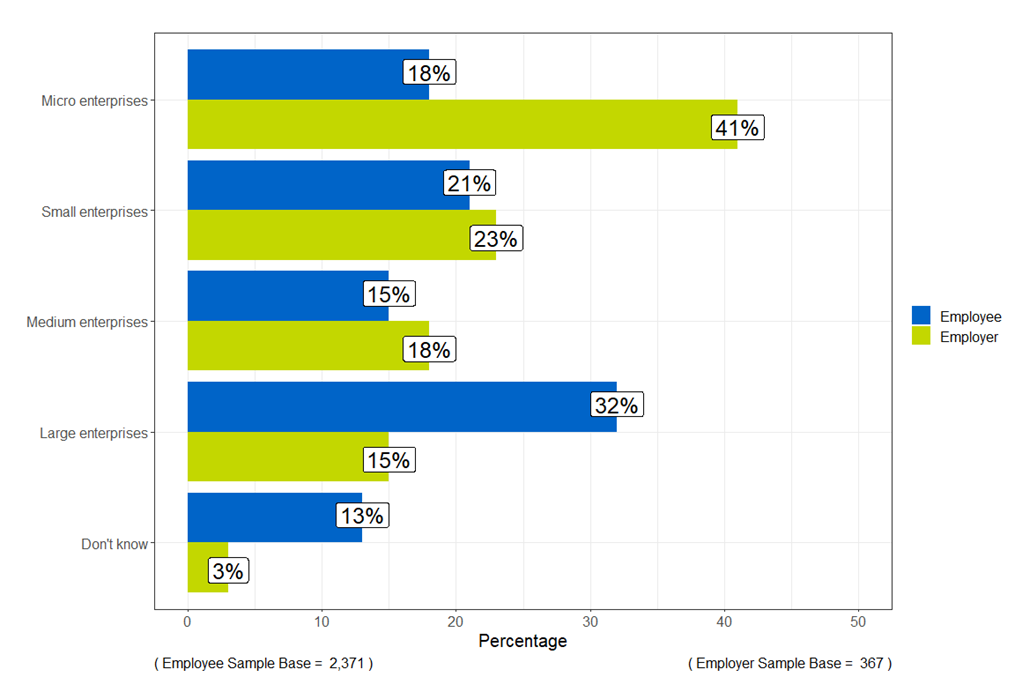
Overall, the respondents were more likely to be calling from large enterprises (30%) rather than micro (21%), small (21%) or medium-sized enterprises (16%). 12% did not know the approximate number of employees working for the organisation.
Interestingly, employees (32%) were significantly more likely to state they were from large enterprises than employers (15%). Contrarily, employers (82%) were significantly more likely to be working for SMEs compared to employees (54%).
Organisation industry type
Respondents were asked about the primary business activity of the organisation they called about. The responses were then attributed a Standard Industrial Classification (SIC) code. Descriptions of these codes, alongside the percentage of respondents falling into each industry grouping are shown in table 1 below. 2,282 of employees and 346 employers provided an attributable response.
As shown below, the "human health and social work activities" industry was the most reported for both employees (19%) and employers (16%). This was followed by "wholesale and retail trade; repair of motor vehicles and motorcycles" for employees (13%) and "manufacturing" for employers (13%).
Interestingly, employees (8%) were statistically significantly more likely to work in the transport and storage industry than employers (2%).
Table 1: Respondents were most frequently from the human health and social work activities industry
Standard Industrial Classification (SIC) percentages of employee and employer respondents.
| SIC code description | Employee (n = 2,282) | Employer (n = 346) |
|---|---|---|
| Human health and social work activities | 19% | 16% |
| Wholesale and retail trade; repair of motor vehicles and motorcycles | 13% | 10% |
| Manufacturing | 9% | 13% |
| Transportation and storage | 8% | 2% |
| Education | 8% | 8% |
| Accommodation and food service activities | 7% | 9% |
| Administrative and support service activities | 7% | 10% |
| Construction | 4% | 5% |
| Public administration and defence; compulsory social security | 4% | 2% |
| Other service activities | 4% | 6% |
| Information and communication | 3% | 6% |
| Financial and insurance activities | 3% | 1% |
| Professional, scientific and technical activities | 2% | 4% |
| Arts, entertainment and recreation | 2% | 3% |
| Agriculture, forestry and fishing | 1% | 1% |
| Water supply, sewerage, waste management and remediation activities | 1% | 1% |
| Activities of households as employers; undifferentiated goods- and services-producing activities of households for own use | 1% | 0% |
| Mining and quarrying | 0% | 0% |
| Activities of extraterritorial organisations and bodies | 0% | 0% |
Occupation type
Respondents were asked about their job name or title. The responses were then attributed a Standard Occupational Classification (SOC) code. Descriptions of these codes, alongside the percentage of respondents falling into each occupational grouping, are shown in table 2 below. 2,252 of employees and 343 of employers provided an attributable response.
As shown below, for employees most were within "administrative and secretarial occupations" (21%) and secondly those in "professional occupations" (13%). For employers, most were "managers, directors and senior officials" (45%) followed by "administrative and secretarial occupations" (24%).
Table 2: Employee respondents were most frequently from an administrative and secretarial occupation compared to employers being managers, directors and senior officials
Standard Occupational Classification (SOC) percentages of employee and employer respondents.
| SOC code description | Employee (n = 2,252) | Employer (n = 343) |
|---|---|---|
| Administrative and secretarial occupations | 21% | 24% |
| Professional occupations | 13% | 18% |
| Caring, leisure and other service occupations | 12% | 2% |
| Process, plant and machine operatives | 11% | 1% |
| Associate professional occupations | 10% | 4% |
| Managers, directors and senior officials | 9% | 45% |
| Sales and customer service occupations | 8% | 1% |
| Elementary occupations | 8% | 2% |
| Skilled trades occupations | 7% | 1% |
Human resources department and trade union membership
46% of employers stated their workplace had an HR or personnel department, while 51% stated that it did not and 3% did not know.
76% of employers stated they had responsibility for introducing or changing policies or procedures in their workplace, while under a fifth (18%) stated that they did not. A "don't know" response was available for this question, which was selected by 6% of respondents.
Employees were asked if they were a member of a trade union. In total, just under a fifth (19%) answered they were in a trade union, with 78% stating that they did not belong to a trade union and 3% did not know.
Of those employees that knew whether they were part of a trade union or not, those from "public administration and defence; compulsory social security" (51%), "education" (33%) and "human health and social work activities" (25%) were significantly more likely to be a member of a trade union.
On the other hand, those in the "accommodation and food service activities" (3%) and "wholesale and retail trade; repair of motor vehicles and motorcycles" (11%) industries were statistically less likely to be a member of a trade union.
Sex
To ensure Acas is creating fair and inclusive workplaces by meeting the needs of all sections of society, the respondents were asked to answer some questions relating to their sex, age, ethnicity, and health or disability status. Respondents were made aware that they were free not to answer these questions.
During August 2021, the sex question was changed on the helpline survey to align to the Government Statistical Service (GSS) harmonised standard (Government Analysis Function, 2019). The figures quoted below, and within figure 5, only contain data from this period onward.
Over this period, only 1% of respondents chose not to disclose their sex.
Of the 1,715 who disclosed their sex, the majority of employees and employers calling the helpline were female (61% and 73% respectively).
Age
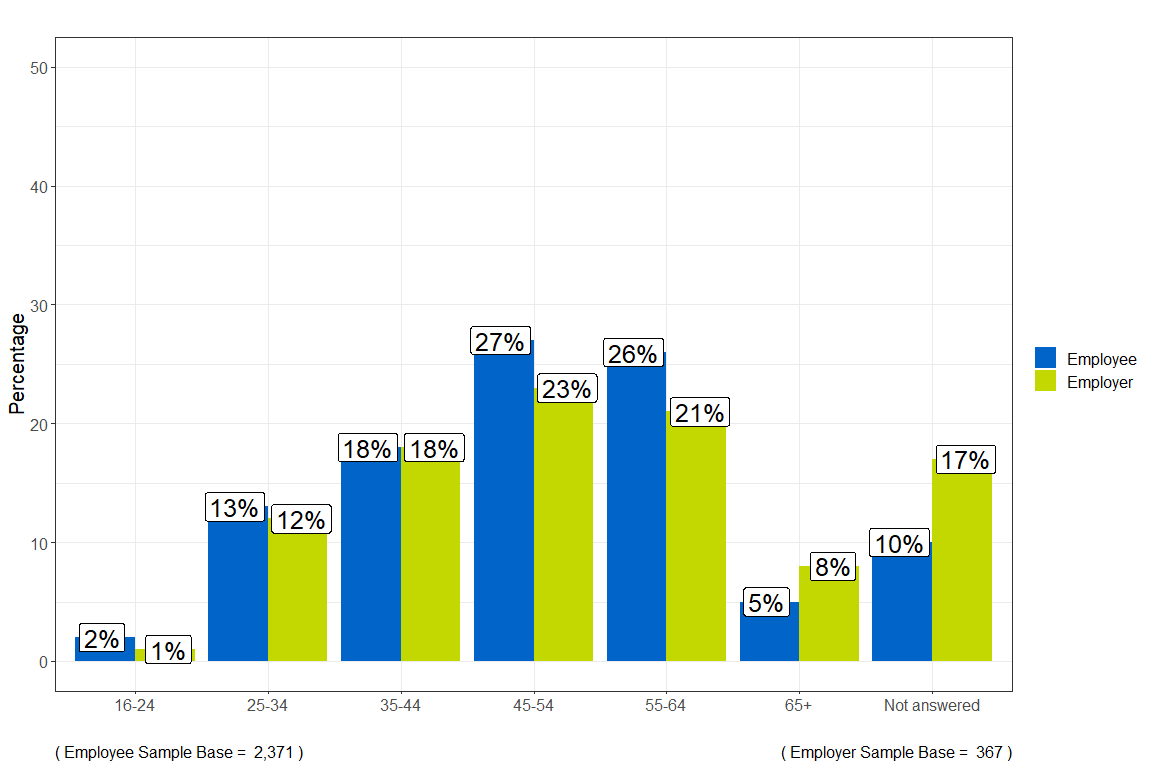
The age groups of the respondents are shown in figure 6. 11% of respondents chose not to disclose their age.
As might be expected, there was a low proportion in the age 65 and over category (5%) with most being represented in the middle-age groups, 44 to 54 (26%) and 55 to 64 (25%). Only 2% of respondents were aged 16 to 24. There were no significant differences between caller types (employee or employer). The mean age of the respondents was 48 years.
Employers were significantly more likely to state that they would prefer not to disclose their age (17%) compared to 10% of employees.
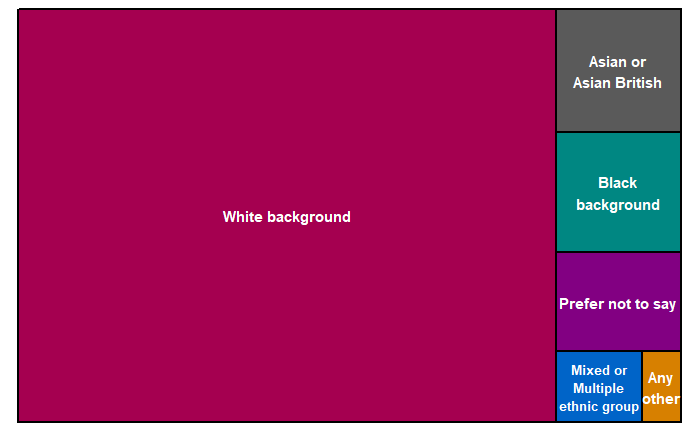
Ethnicity
Of those respondents who chose to provide a response about their ethnicity, 81% of callers identified themselves coming from a white background (71% of respondents identified as "British, English, Northern Irish, Scottish, or Welsh"). 6% identified as "Asian or Asian British" and 5% identified as "Black or Black British".
There were no significant differences between caller types with 81% of employees and 82% of employers being from a white background.
Furthermore, respondents were asked whether they spoke English as their first or main language. 91% answered in the affirmative for this question, with 8% stating they did not, and the remainder preferring not to say or did not know.
Disability and health issues
Respondents were asked whether they have a long-term health problem, illness, or disability. 6 in 10 (60%) respondents stated they did not have a longstanding illness or disability, while 32% stated that they did. 8% of respondents chose "prefer not to say", "don't know", or did not answer the question.
Employees were significantly more likely to state that they had a disability or long-standing health issue when compared to employers (34% and 18% respectively). Furthermore, employees were significantly more likely to not know if they had a long-term health problem, illness, or disability (3% compared to 0% of employers).
Area of the UK
Of the 2,706 respondents who provided the area of the UK, the highest frequency responded they worked in London (15%) or the South East (15%). This was followed by 12% stating they worked in the North West. The rest of the UK were relatively evenly spread.
Journey to the helpline
How did you become aware of the Acas helpline?
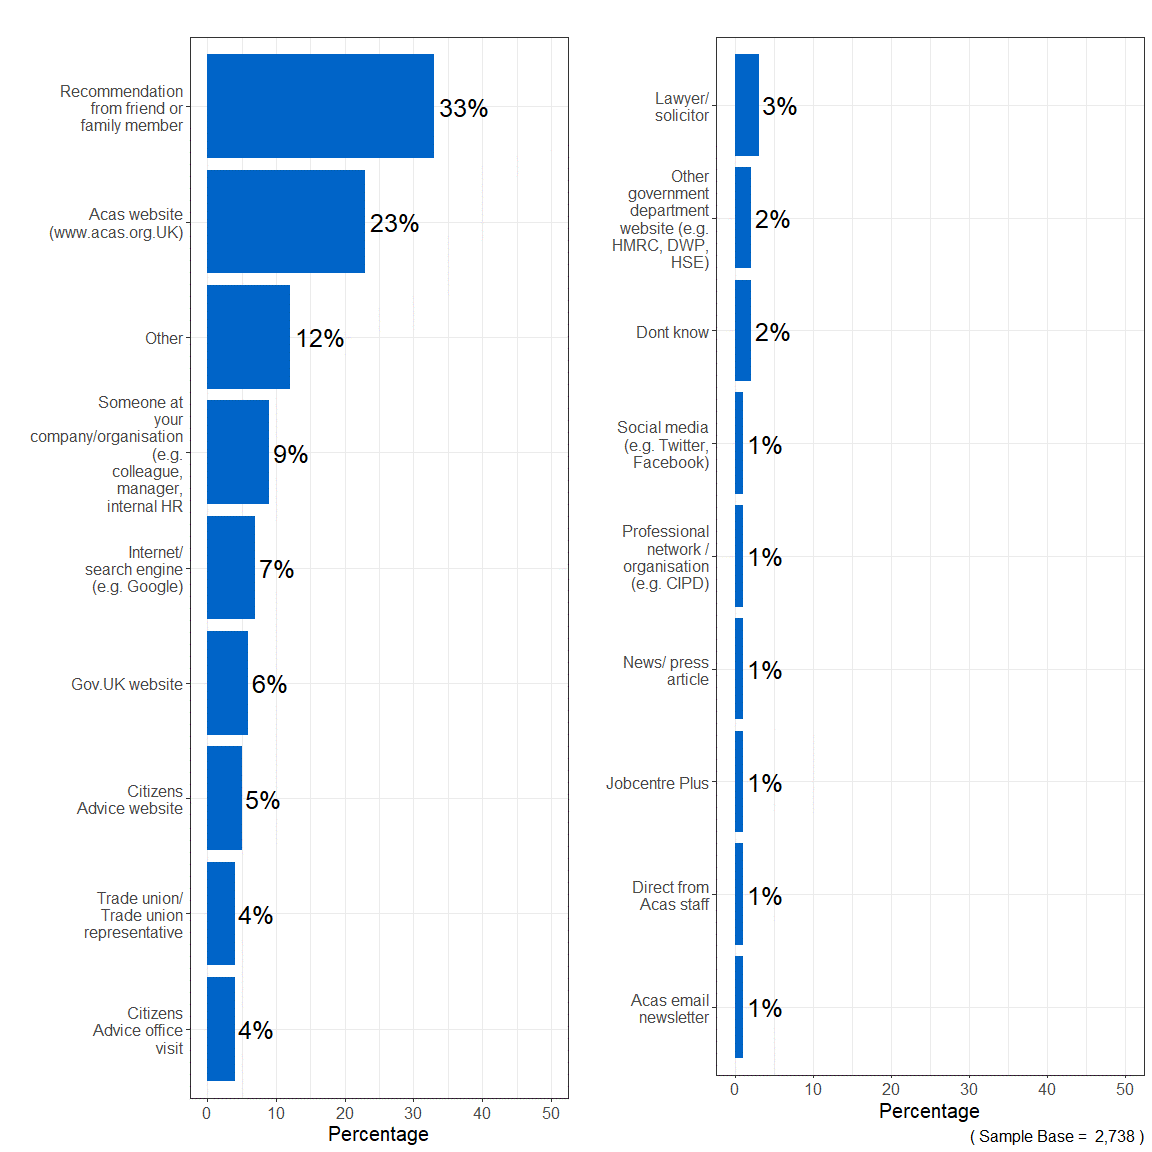
Respondents were asked how they became aware of the Acas helpline. Respondents could choose more than one response. The responses are illustrated in figure 8. Any responses with less than 1% of respondents have been excluded.
The most common response was that they had heard about the helpline through a recommendation from a friend or family member (33%). This is an encouraging indication that people are recommending the helpline.
The next most popular response was that respondents found out about the helpline through the Acas website (23%). 7% responded that they had completed an internet search for the helpline. Respondents were unlikely to have heard about the helpline via social media, with just 1% stating this was the case.
The third most frequent response was "other" with 12% of respondents selecting this response for the question. When asked to provide further detail, common answers were that they had professional knowledge (for example through working in finance, HR or law) or had previously used the helpline. Other respondents referenced charities such as Macmillan.
Use of alternative resolution
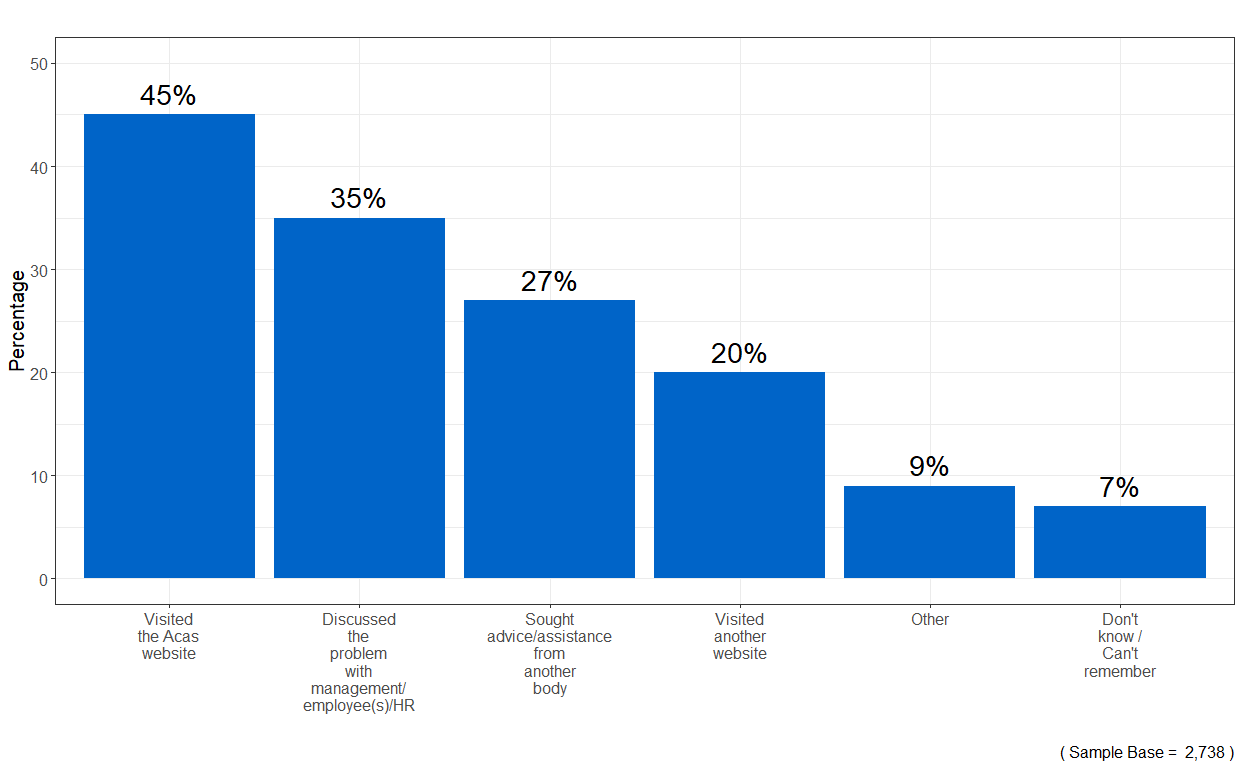
Respondents were asked whether they had attempted to answer their query in another way prior to calling the helpline. Respondents could choose more than one response.
Less than half (45%) had visited the Acas website, and 35% had discussed the issue with their management, employee(s) or HR. 27% had sought advice from another body; for example, trade union, solicitor, Citizens Advice, online resources or professional organisation. While 1 in 5 (20%) visited another website in an attempt to answer their query.
Employers were significantly more likely to have visited the Acas website (60% compared with 43% of employees). Also, employers were significantly more likely to have visited another website (27%), compared with 19% of employees, to answer their query before calling the helpline. Alternatively, employees were significantly more likely to have sought advice or assistance from another body (29% compared with 15% of employers).
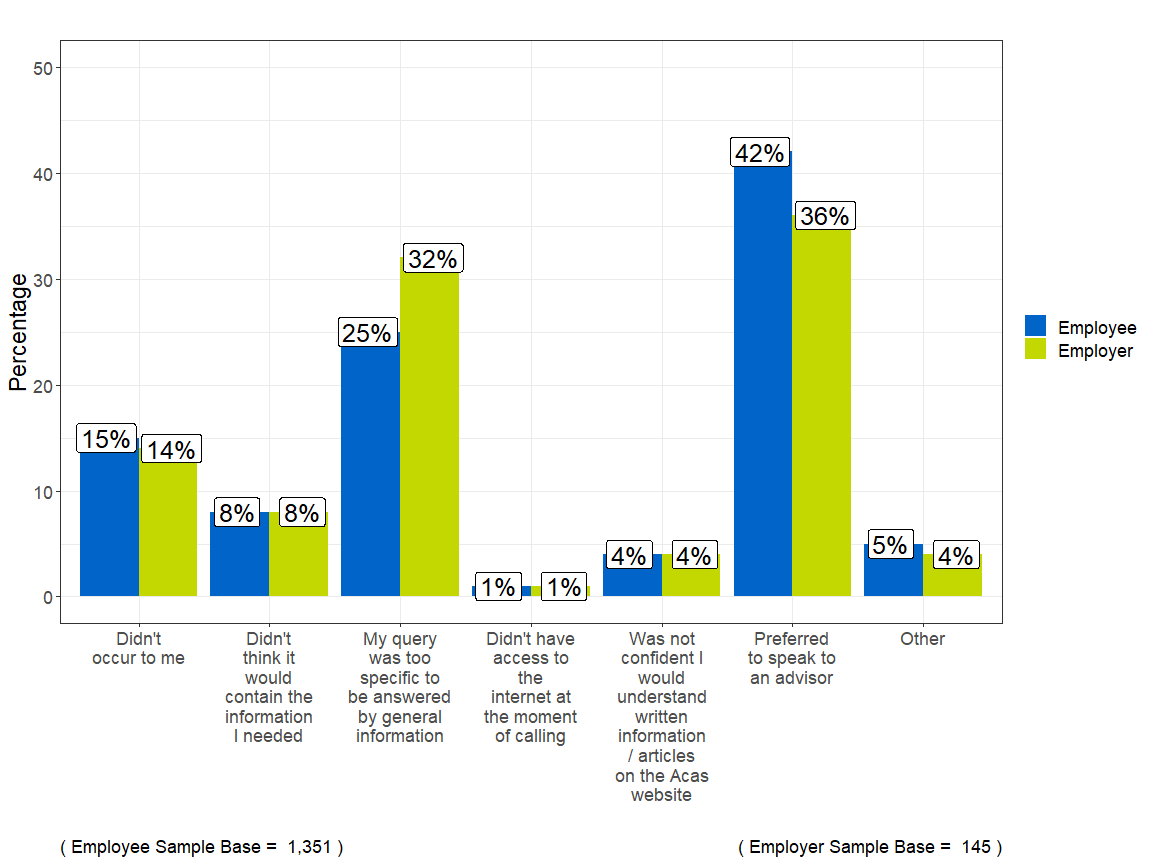
Reasons for not visiting the Acas website
The 1,496 respondents who did not visit the Acas website prior to calling the helpline were asked their reasons. Overall, the most frequent response was that respondents would prefer to speak to an adviser (42%), followed by the query being too specific to be answered by general information (25%).
5% of respondents selected the "other" response for this question. These included those who had not heard of Acas and a respondent stating the lack of British Sign Language videos on the Acas website meant they could not access the information.
Reasons for calling after visiting the Acas website
The 1,242 respondents who visited the Acas website prior to calling the helpline, but still chose to call, were asked their reasons for calling. Respondents could choose more than one response.
Overall, the most frequent response was the website only answered part of their question or they needed more information (49%), followed by the participant wanting to confirm about what they had read or to check their interpretation was correct (37%) and they did not find any of the information they needed on the website (26%).
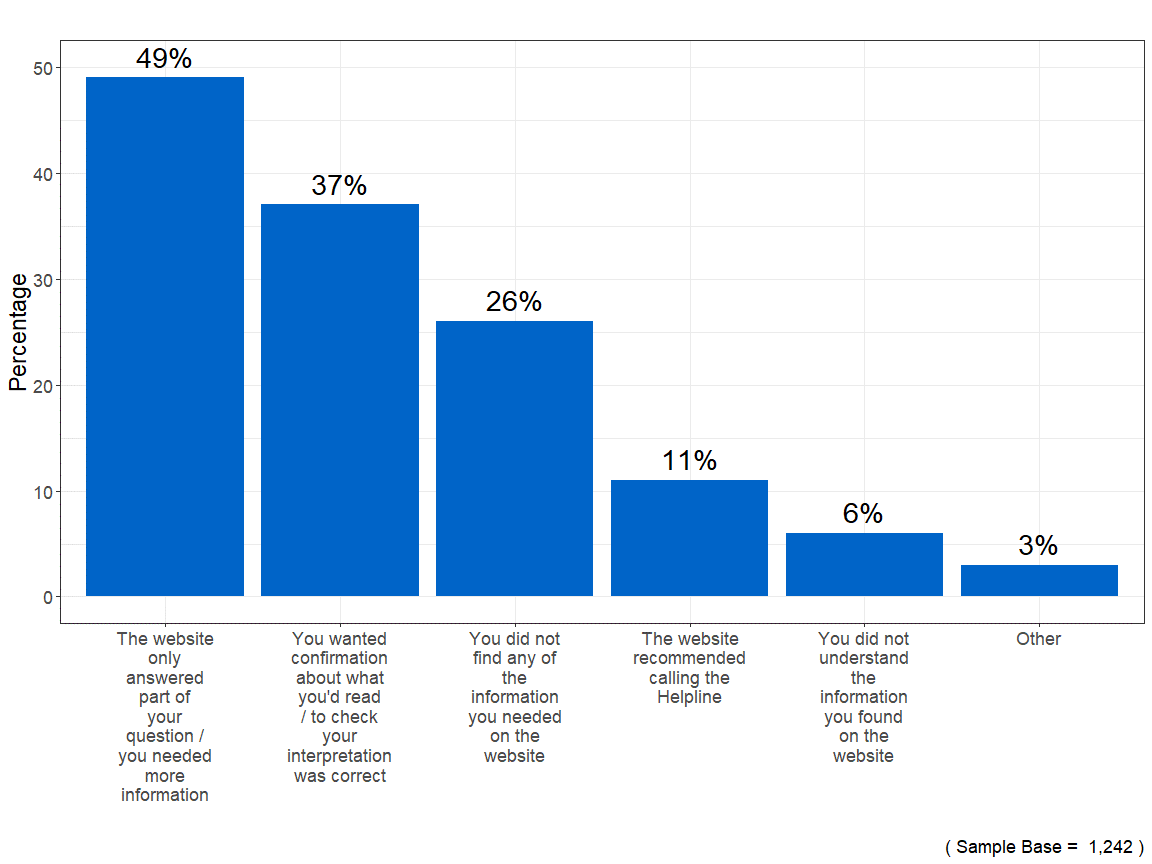
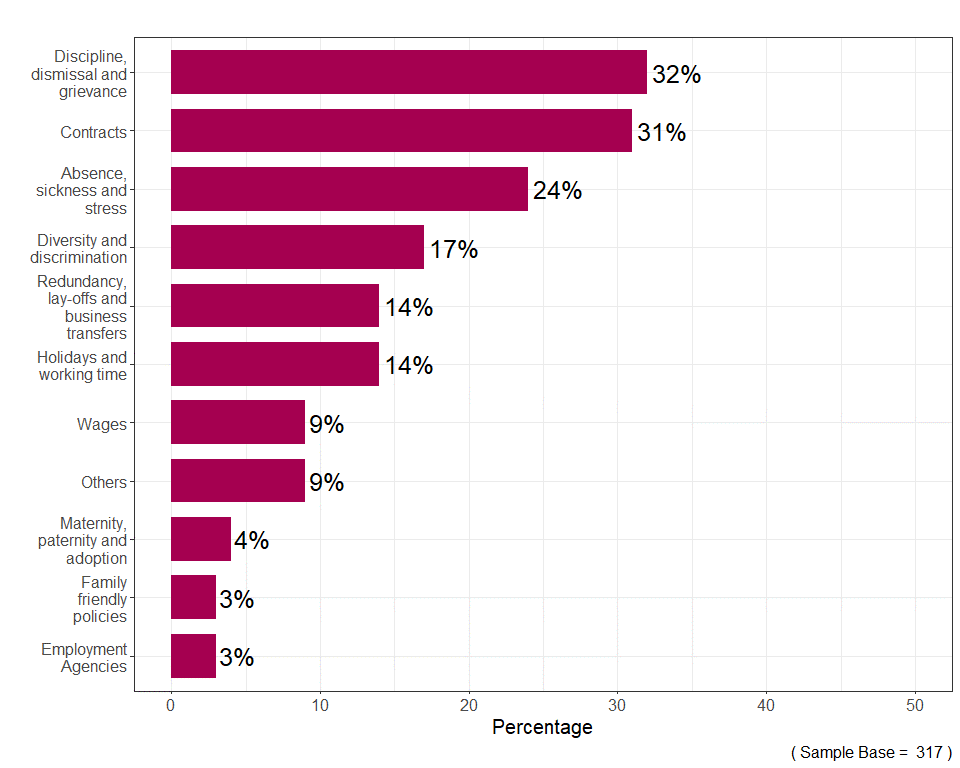
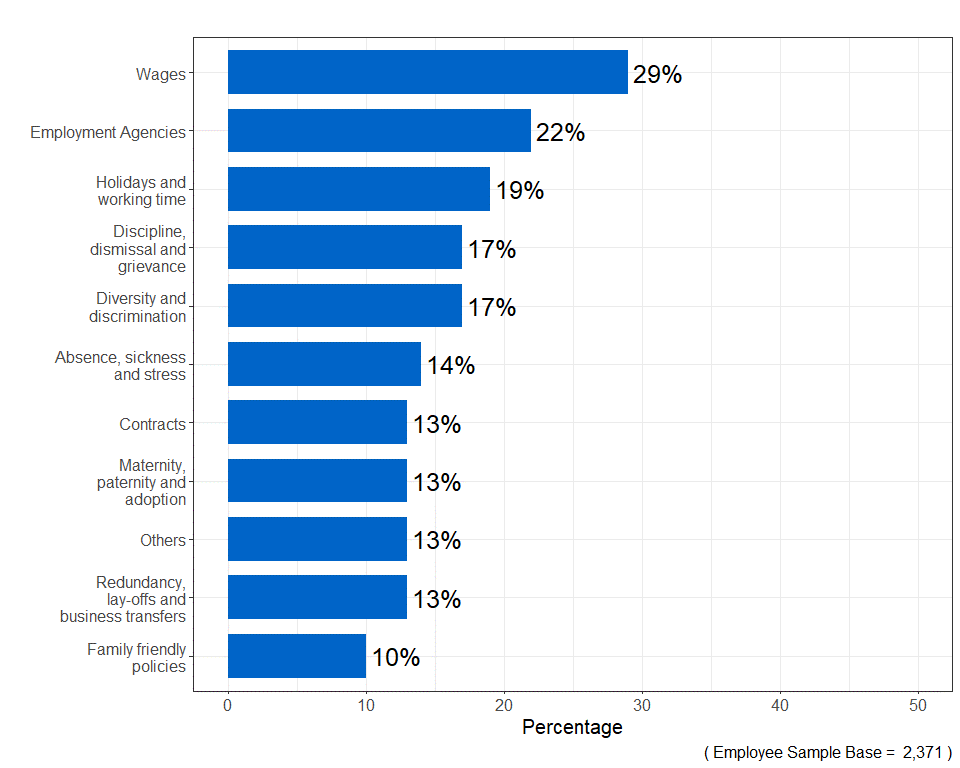
Figure 12 outlines the subject matter of the call when the caller stated they could not find any of the information on the Acas website. Respondents could choose more than one subject matter being discussed with the helpline adviser.
32% of those who stated they could not find relevant information on the Acas website were calling about an issue which included a discussion on a discipline, dismissal and grievance subject. This was closely followed by 31% when the call included a contracts subject.
Concerns over a claim to the employment tribunal
13% of the employer respondents stated they contacted the helpline because they were concerned that one or more employees was considering making a claim to an employment tribunal.
Accessing the helpline
Number of call attempts
Respondents were asked how many times in total they had called the helpline before getting through to an adviser. Positively, the majority of respondents (87%) only needed to call the helpline once before reaching an adviser. A further 10% stated that they called the helpline 2 to 3 times, and 1% stated that they had called 4 to 5 times. Less than 2% of callers stated it took 6 or more times until they reached an adviser.
Respondents who reached the helpline on their first attempt were significantly more satisfied with the overall helpline service compared to those who had to call 2 or more times before receiving an answer. 54% of callers reaching the helpline on the first attempt reported they were extremely satisfied with the overall helpline service compared to 34% who needed two or more attempts.
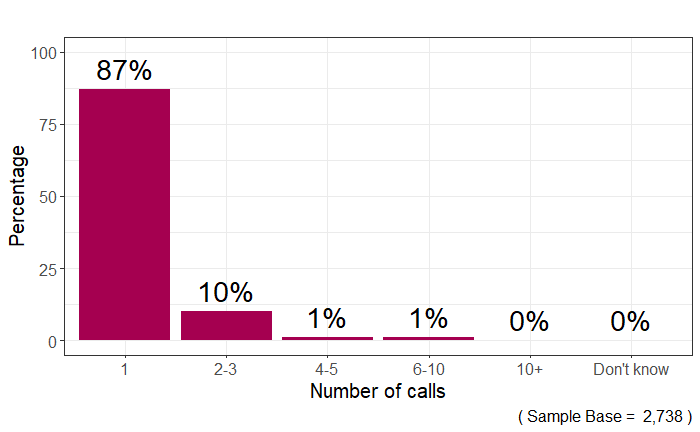
Figure 15 shows the number of call attempts according to the month in which the call was made. Call attempts stating more than 6 calls have been excluded due to the low proportion of respondents selecting these responses.
Respondents were asked how satisfied they were with the length of time taken for their call to be answered. The majority of respondents (96%) were satisfied (either "extremely", "very" or "fairly"), with 3% stating "neither satisfied nor dissatisfied" and just 1% were "fairly dissatisfied". Less than 1% of respondents stated that they were "very" or "extremely dissatisfied" with the length of time it took for their call to be answered.
96% of respondents stated they were satisfied ("extremely", "very" or "fairly") with the length of time it took the call to be answered.
Reason for the call
Call subject
Respondents were asked to select from a list of options on which topics were covered by their call to the helpline. They were able to select multiple options.
Examples of sub-topics covered by the core subject matter were provided in the survey. However, the respondents are not subject matter experts and therefore some caution should be applied on their choice of call subjects.
These core subjects and examples provided in the survey are outlined in table 3:
Table 3: Subject list and examples
| Subject topic | Subject examples |
|---|---|
| Absence, sickness and stress | Absence, sick pay, stress |
| Diversity and discrimination | Discrimination related to race, disability, religion, age, sex, sexual orientation, gender reassignment |
| Employment agencies | Contracts and terms, non-receipt of contract, advertising jobs overseas, contract conditional on buying goods and services, entertainment and model agencies |
| Family-friendly policies | Flexible working regulations, rights of part-time workers, time off for dependants |
| Holidays and working time | Holiday entitlement, Working Time Regulations, bank and public holidays |
| Maternity, paternity and adoption | Maternity rights, paternity rights, parental leave, leave relating to adoption |
| Redundancy, lay-offs and business transfers | Redundancy, redundancy pay, lay-offs, short-time work, company take-over or merger |
| Wages, including National Minimum and Living Wage | Non-payment or deduction of wage, National Minimum and Living Wage, other wage issues |
| Discipline, dismissal and grievance | Discipline procedure, dismissal, grievance procedure, bullying, harassment, constructive dismissal |
| Others | References, retirement, physical mistreatment, modern slavery, anything else |
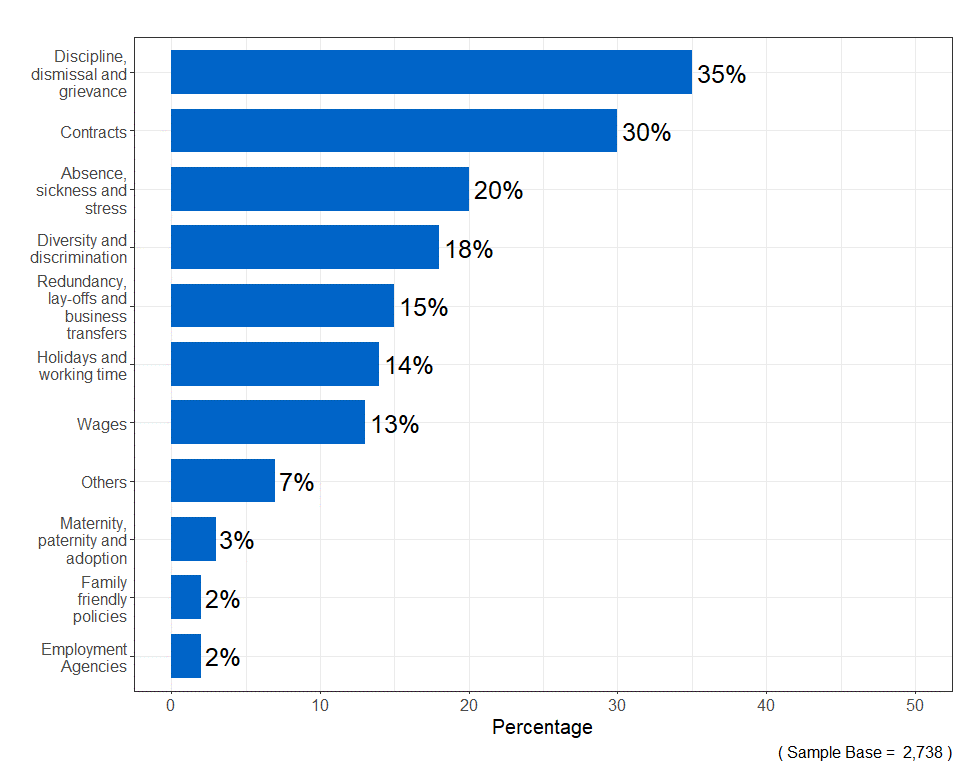
Overall, the most common topic covered was discipline, dismissal and grievance, which was cited by 35% of respondents. This was followed by contracts, cited by 30% of respondents, and absence, sickness and stress, cited by 20% of respondents. 7% of respondents selected "other" for this question.
When asked for further details, a variety of answers were given including, but not limited to, health and safety, flexible working, return to office arrangements and mental health.
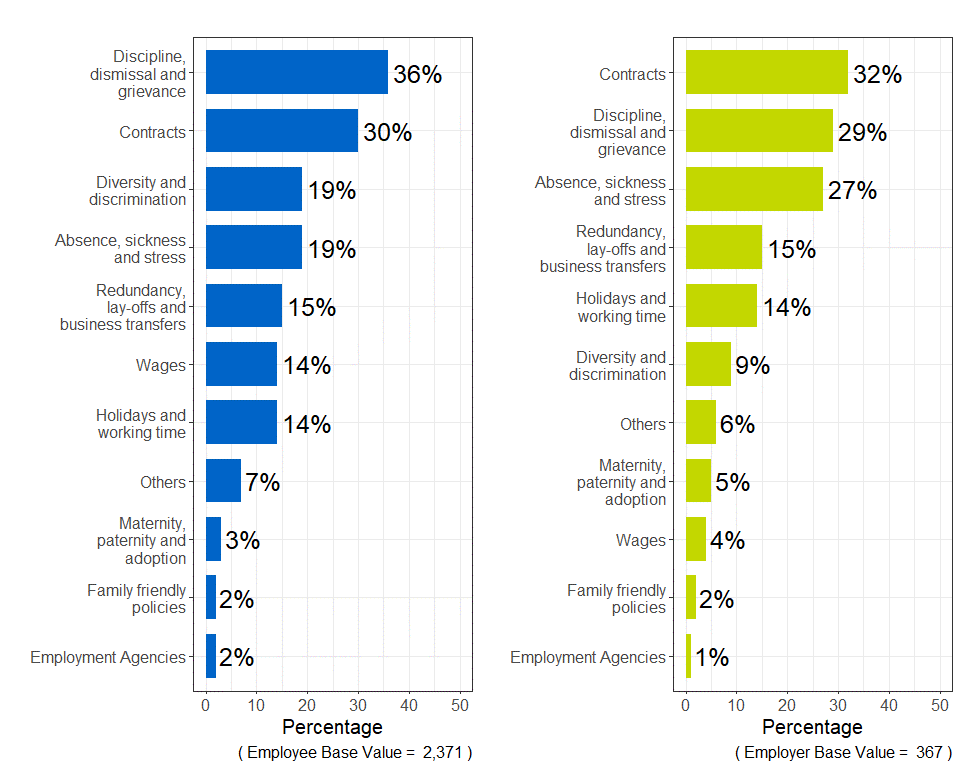
Call subject by caller type
As expressed in figures 18 and 19 below, employees and employers stated the most frequent queries were regarding discipline, dismissal and grievance or a contracts subject. However, the subject of highest frequency was reversed, with employees stating discipline, dismissal and grievance (36%) and employers responding with contracts (32%).
It should be advised the subjects chosen are the perceived subjects by the respondent and different respondents may have different interpretations or understanding of the subject matter.
For example, the subject "diversity and discrimination" may be interpreted differently by an employee respondent compared to an employer respondent or a helpline adviser.
Call subject by dispute resolution stage
During the call, the helpline adviser captures some additional information about the nature of the call. This includes categorising the call according to its "dispute resolution stage" depending on the information provided by the caller. This information about the call is not collected through the survey but added by the helpline adviser.
The helpline adviser categories the calls as follows:
- information request – the call is a request for information only, there is no dispute between employee and employer
- informal action – there is a dispute between the employee and employer, but they have yet to speak to each other. There is need to try and resolve by the employee and employer speaking to each other in the first instance
- formal action – the start of a formal procedure on something, for example a disciplinary or grievance process
- employment tribunal – internal workplace procedures have been exhausted or the caller insists that they're not going to follow internal process and wants to start a claim or proceed to early conciliation
- enforcement complaints – where there is a referral to an enforcement body
- not clear – anything that does not fit into the above categories, or where the helpline adviser does not have enough information to categorise the call
The percentages of respondents by their dispute resolution stage are stated below:
- information request 26%
- informal action 17%
- formal action 50%
- employment tribunal 6%
- and 6. enforcement complaints or "not clear" – the remaining 1% consisted of either calls at the enforcement complaints stage, that were not clear on the dispute resolution stage, or the information had not been recorded
Table 4 below shows the subject of the call according to the dispute resolution stage. Respondents were able to select multiple subjects for the call.
Those asking for an information request or in the informal stages of the dispute resolution process were more likely to be making enquiries involving contracts. Conversely, those in the formal stages or at employment tribunal were more likely to be making enquiries discussing discipline, dismissal and grievances.
Table 4: Respondents were most frequently calling discussing contracts in the early stages of dispute resolution compared to a discipline, dismissal and grievance query in the latter stages
Percentage of topics discussed during the dispute resolution stages.
| Subject topic | Information request (n = 707) | Informal action (n = 464) | Formal action (n = 1,374) | Employment tribunal (n = 158) |
|---|---|---|---|---|
| Contracts | 33% | 35% | 27% | 23% |
| Discipline, dismissal and grievance | 28% | 30% | 40% | 42% |
| Absence, sickness and stress | 21% | 21% | 21% |
16%
|
| Redundancy, lay-offs and business transfers | 18% | 16% | 14% | 13% |
| Holidays and working time | 15% | 18% | 13% | 13% |
| Diversity and discrimination | 14% | 20% | 19% | 24% |
| Wages | 11% | 12% | 13% | 25% |
| Others | 7% | 6% | 6% | 8% |
| Maternity, paternity and adoption | 4% | 4% | 3% | 1% |
| Family-friendly policies | 2% | 1% | 2% | 1% |
| Employment agencies | 1% | 2% | 2% | 4% |
Calls by levels of urgency, complexity and stress
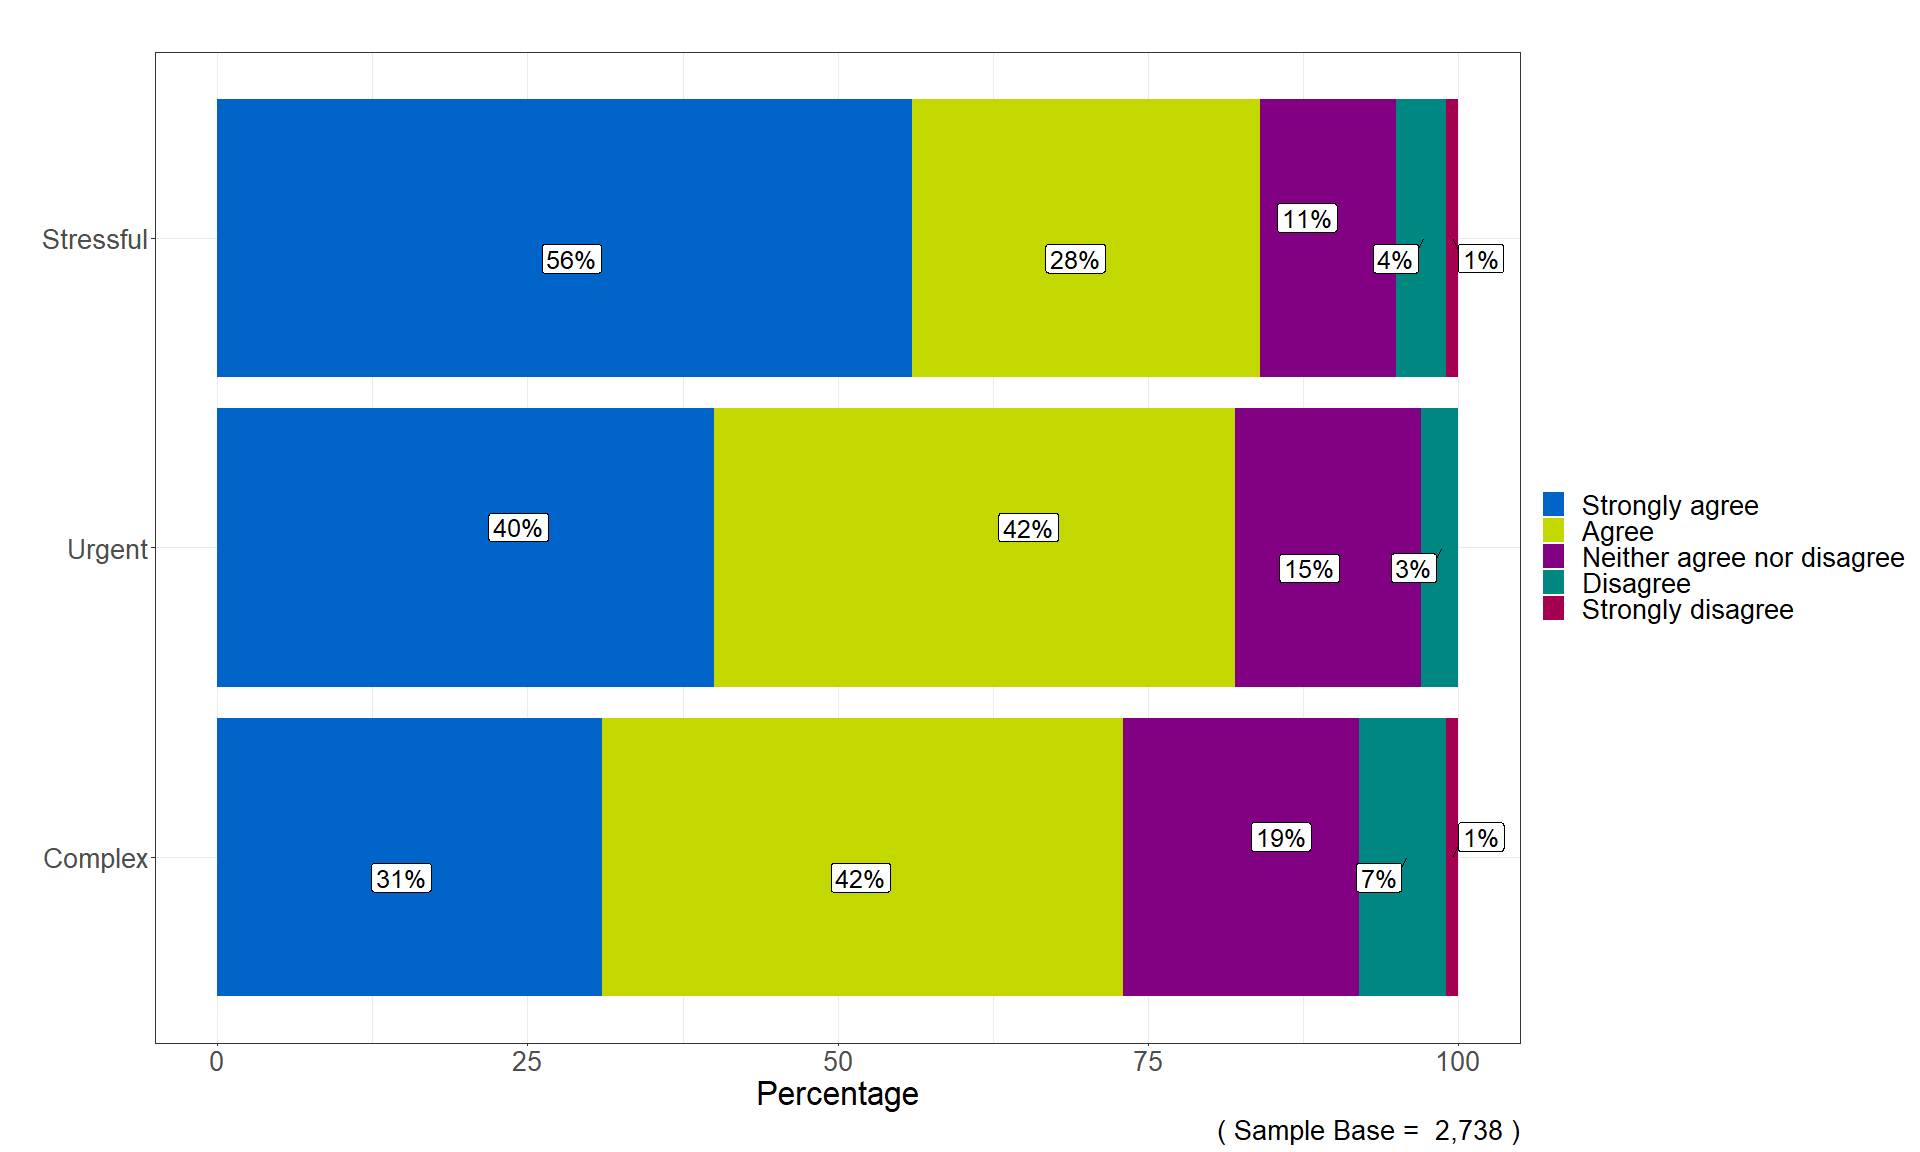
Respondents were asked the extent to which they agreed or disagreed their enquiry was stressful, urgent and complex. Overall, there was a high level of agreement (either "strongly agree" or "agree") with each of these statements (84% stressful, 82% urgent and 73% complex).
Nearly 1 in 5 (19%) "neither agreed or disagreed" that their call was complex compared to 11% and 15% for "stressful" and "urgent" respectively. None of the statements have a level of disagreement (either "strongly disagree" or "disagree") above 8%.
Employers were significantly less likely to agree that the issue they were calling about was urgent or stressful compared to employees. 74% of employers either strongly agreed or agreed that their query was urgent, compared with 82% of employees. Furthermore, 56% of employers either strongly agreed or agreed that their query was stressful, compared with 88% of employees.
Calls related to covid-19 (coronavirus)
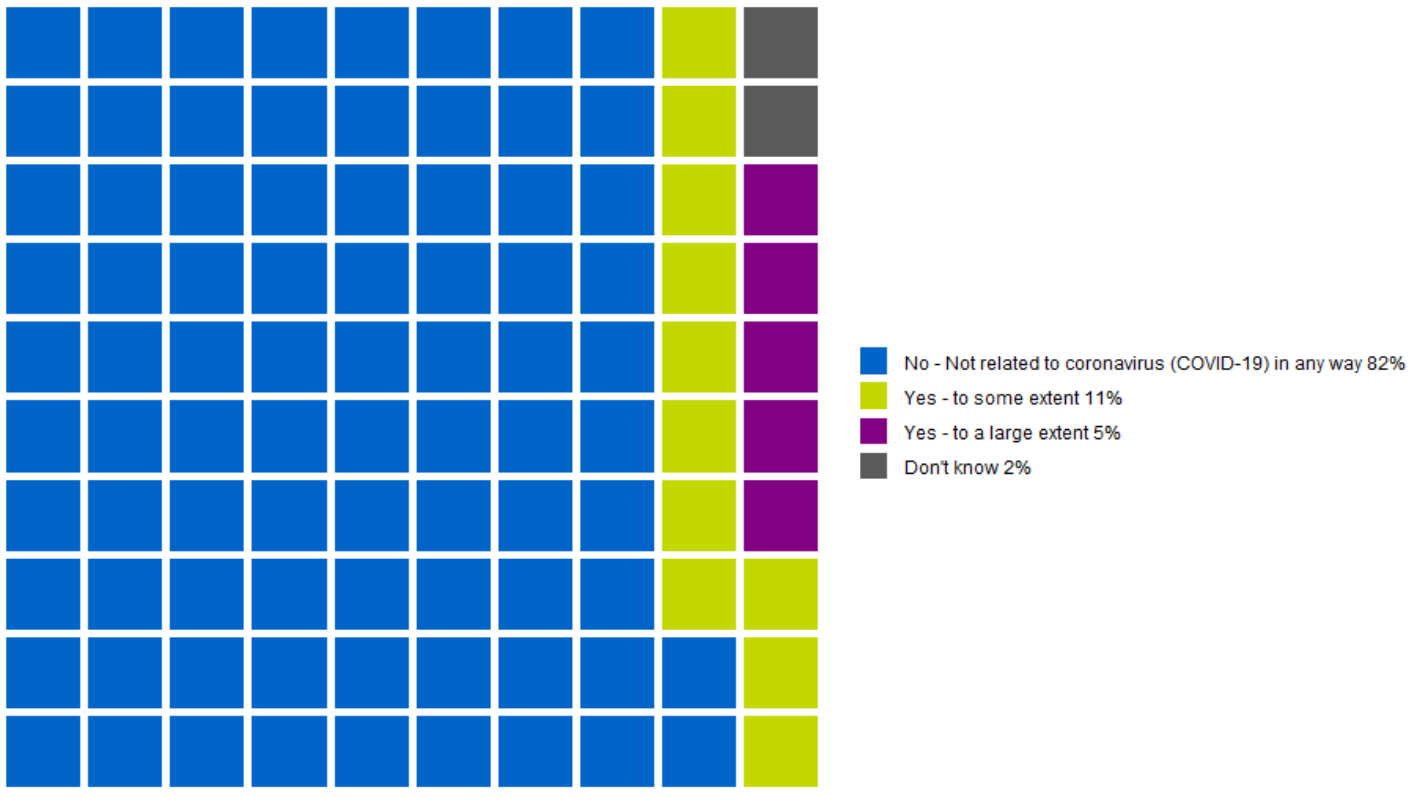
During the operating year 2021 to 2022, Acas has been monitoring the calls handled by the helpline that are related to covid-19 (coronavirus), to ensure that we are offering appropriate advice and information to these callers.
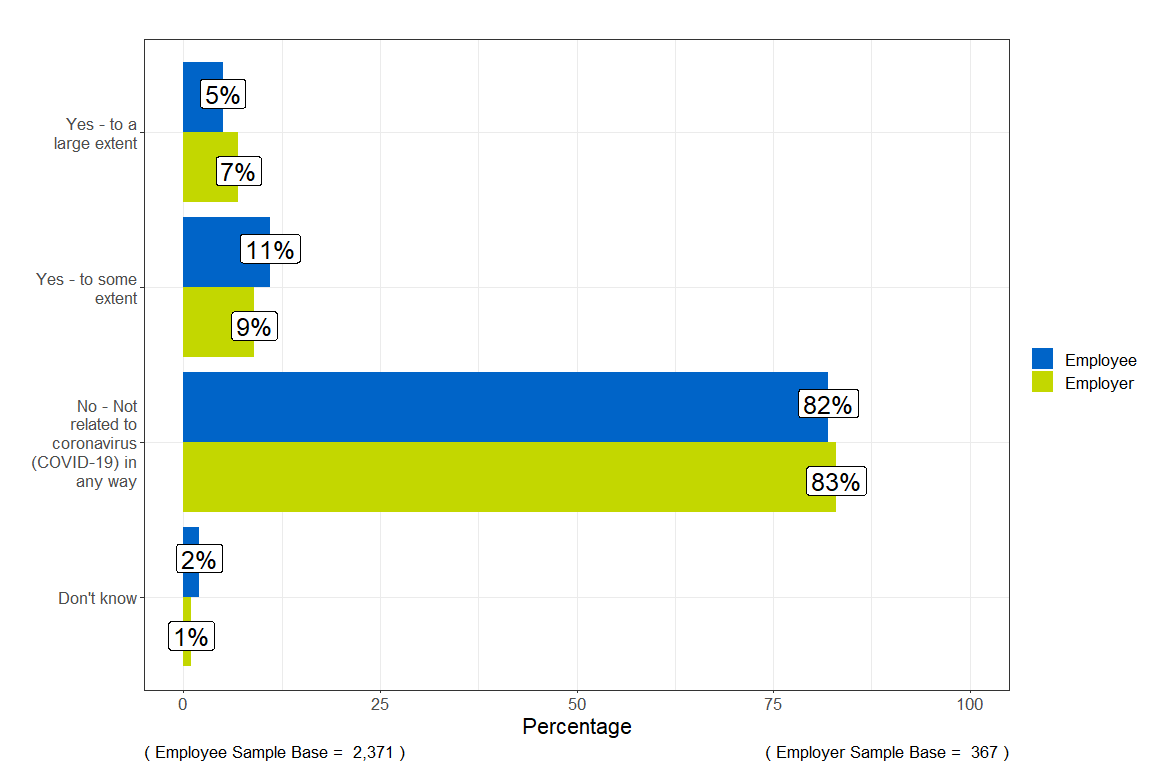
2,738 responded to the question and the majority (82%) were not discussing covid during their query. This is compared to 16% who stated that the call related in some degree to covid and 2% did not know.
Covid by monthly calls
The respondents who stated they were calling regarding covid to the helpline peaked at 26% during April 2021 and was at its lowest level during February 2022 (8%).
Covid by caller type
As expressed in the Figure 23 below, the proportion of employees or employers who were calling the helpline regarding a covid query, either to some or a large extent, were the same at 16%.
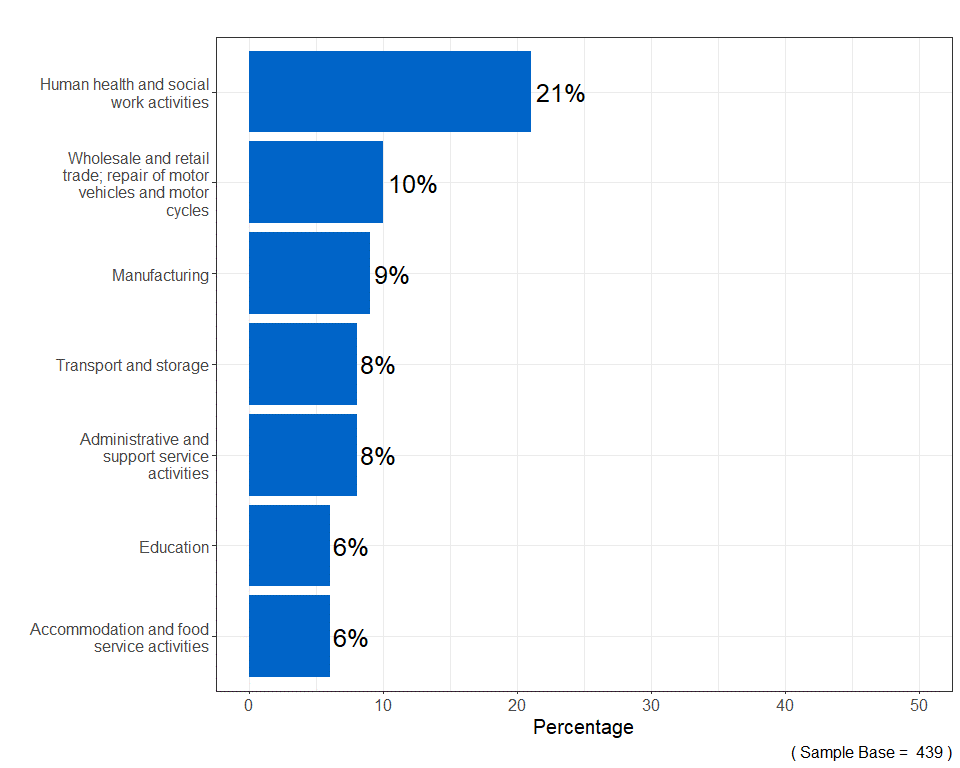
Covid by industry
Figure 24 portrays the top (over 5%) industries which were stated by respondents when calling regarding covid. The "human health and social work activities" industry was the most frequent (21%) when the helpline call involved discussing a covid issue.
This was followed by "wholesale and retail trade"; "repair of motor vehicles and motorcycles" (10%) and "manufacturing" (9%). These industries were 18%, 13% and 9% respectively for calls not relating to covid.
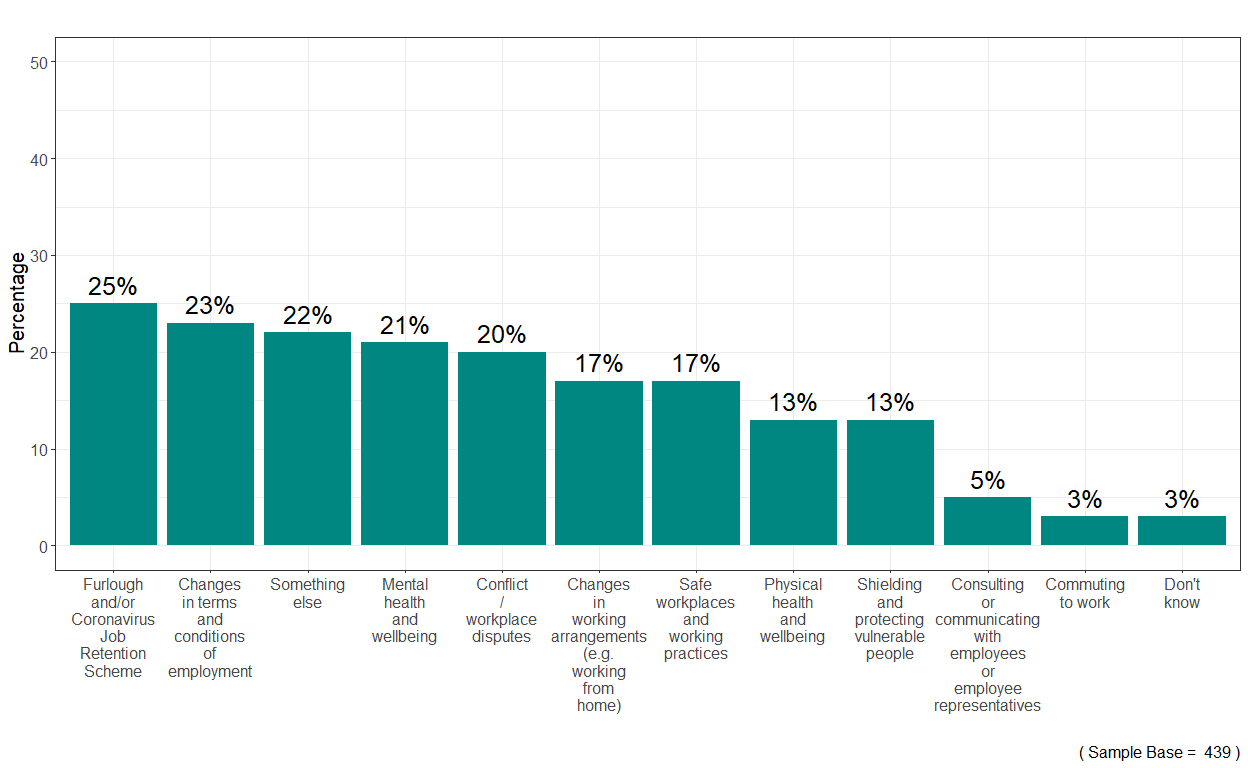
Covid: subject of call
Covid-related respondents could choose multiple responses for the covid subject matter. There was a fairly even spread of discussion, but the most popular topics were "furlough and/or coronavirus job retention scheme" (25%), "changes in terms and conditions of employment" (23%), “mental health and wellbeing" (21%) and "conflict or workplace disputes" (20%).
22% of respondents stated "something else". When asked to provide further detail, common answers were discussions on annual leave and sick pay entitlement, redundancy or suffering the long-term effects of covid.
Covid: furlough
The Coronavirus Job Retention Scheme, commonly known as "furlough", ended on 30 September 2021. Despite the scheme ending, respondents continued to state they had been furloughed when they contacted the helpline past this date. This may be the respondents interpreting the question as if they were calling about a subject when they were on the furlough scheme.
11% of total respondents stated they were furloughed when contacting the helpline. The majority of the total respondents (86%) stated they were not furloughed when they contacted the helpline or did not know (3%).
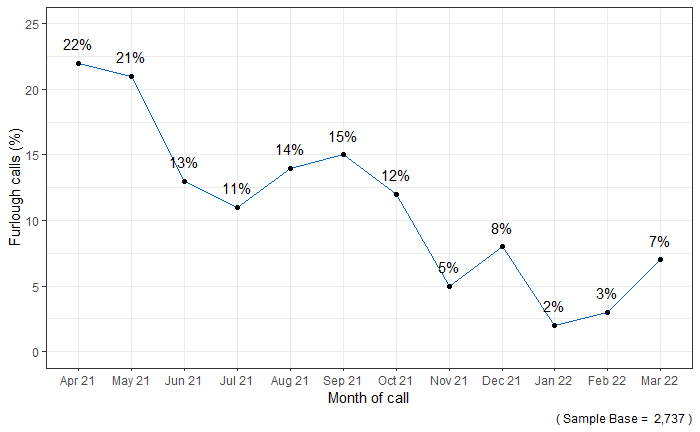
The respondents who stated they were furloughed when calling the helpline peaked at 22% in April 2021 and was at its lowest level in November 2021 (5%).
Covid: future workplace concerns
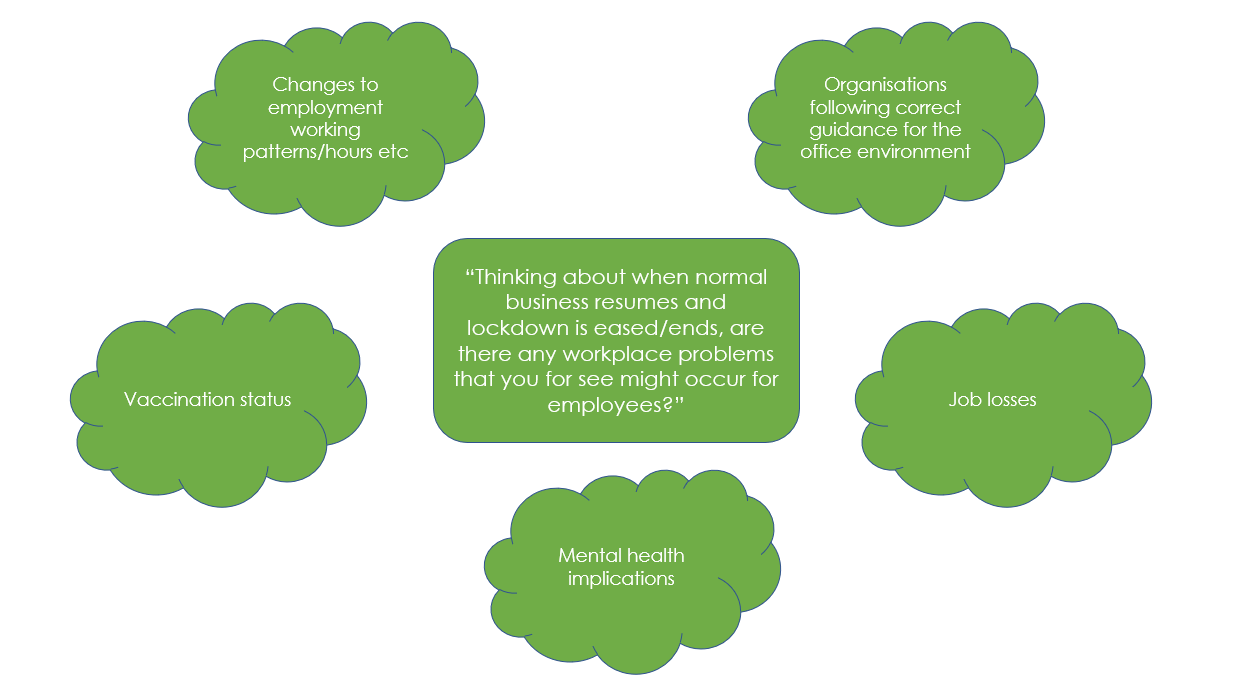
Respondents were asked if they foresee any workplace problems when normal business resumes and covid lockdown is eased or ends.
Employees raised the following potential issues:
Changes to employment working patterns or hours
Employees were concerned that their employer would be enforcing contract changes post covid. Comments included employers' expectations for them to work for less remuneration than pre covid and for staff to be more flexible covering work normally done by a larger workforce. Furthermore, respondents were concerned they would lose their work-life balance when returning to the office.
Organisations following correct guidance for the office environment
Respondents outlined possible issues surrounding their safety when returning to the workplace. Workplace problems over the ventilation in the office space and safety in client-facing jobs were a common theme. These potential issues were primarily discussed where respondents, or their family, are deemed as clinically vulnerable.
Job losses
A common theme from the employee respondents was the risk of redundancy and job losses. Responses highlighting the uncertainty of post covid may lead to company closures or employees feeling vulnerable to job losses if they raise any concerns to their employer.
Mental health implications
Employees raised mental health concerns arising from being on furlough or working from home for a long period. Respondents were unsure how they would adapt to being back in a workplace. Some respondents had commented that their mental health had deteriorated during the pandemic including being diagnosed with anxiety disorders such as post-traumatic stress disorder (PTSD).
Vaccination status
The choice to be vaccinated for covid was mentioned by respondents. Employees stated they may be forced to leave their current role or career due to the personal choice not to be vaccinated. Conversely, employees raised the potential issue of being uncomfortable working with colleagues who were not vaccinated.
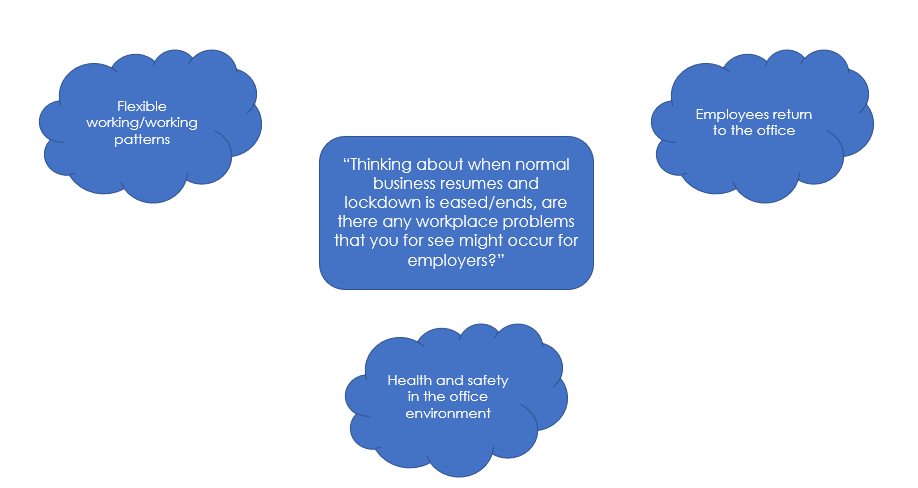
Employers responded with the below concerns:
Flexible working and working patterns
A common theme for employer respondents was the potential problem of balancing an effective working pattern and hybrid working. Comments included the staff resistant to moving back to pre-covid arrangements.
Employees return to the office
Employers stated the potential of employees not wanting to return to the workplace and remain home-based as an area of concern. Furthermore, employers mentioned concerns about ensuring staff were enthusiastic and motivated upon their return.
Health and safety in the office environment
Similar to the employee respondents, the safety of their staff was a potential problem when normal business resumes and lockdown is eased or ends.
Employers mentioned their concerns over implementing safety protocols such as ensuring staff socially distance and introducing better ventilation.
Fire and rehire
The respondents were asked about the practice named 'dismissal and re-engagement', this is sometimes known as 'fire and rehire' or 'dismiss and rehire'. This occurs when either:
- an employer dismisses an employee and offers them a new contract to work in the same role under new terms and conditions
- an employer tells an employee that they may be dismissed and rehired if they do not agree to new terms and conditions
This question was added to the helpline survey in August 2021 and therefore any figures below relate to responses to calls made during the period August 2021 to March 2022.
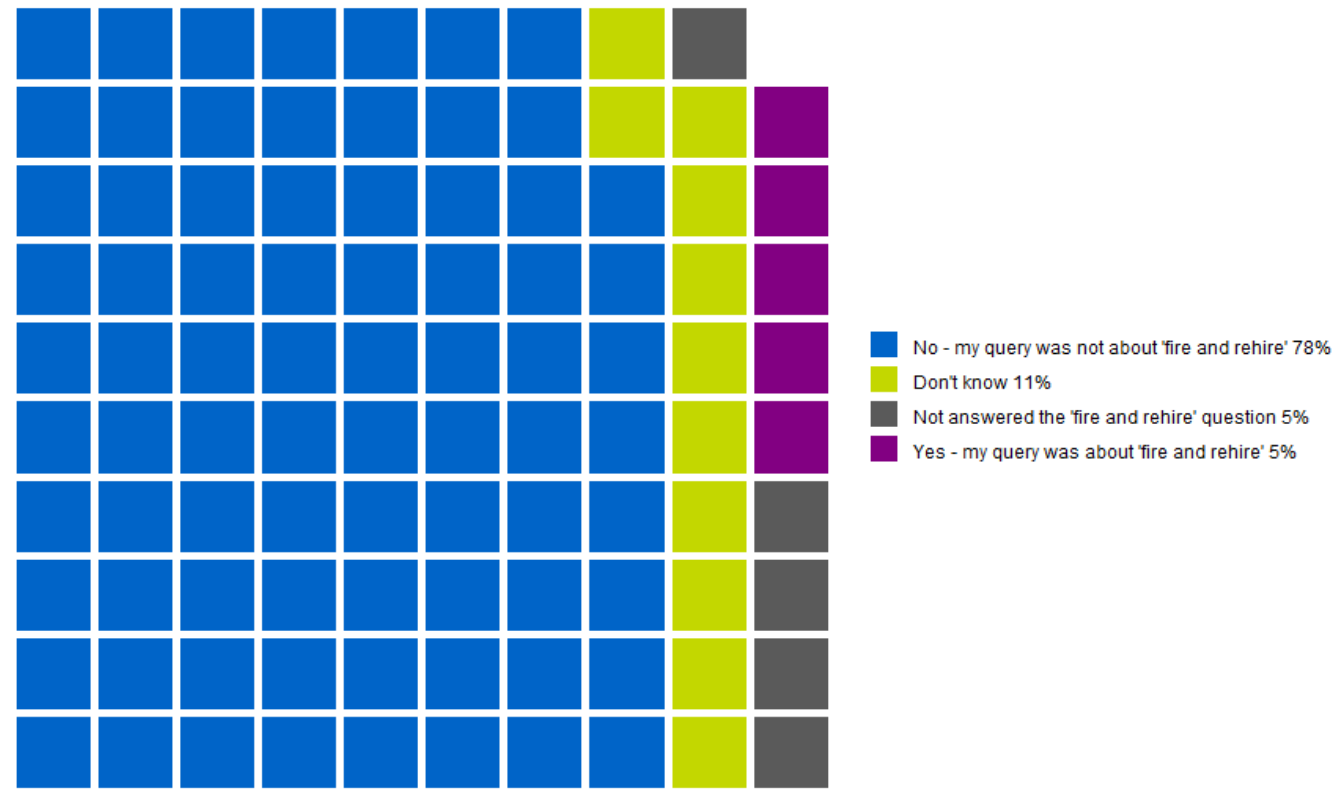
1,765 of respondents were asked this question and the majority (78%) were not discussing the fire and rehire practice. This is compared to 5% stated that the call involved the practice and 16% did not know or did not answer the question.
Fire and rehire by monthly calls
The respondents who stated they were calling regarding the practice of fire and rehire to the helpline peaked at 8% in December 2021 and was at its lowest level of 3% in March 2022.
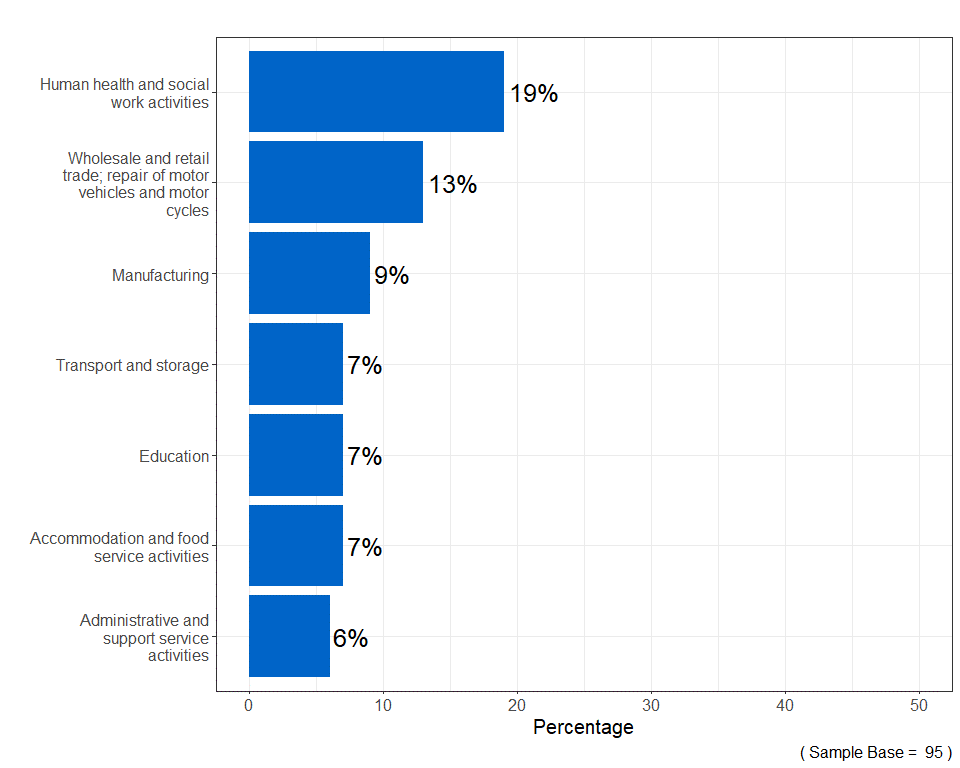
Fire and rehire by industry
Figure 31 portrays the top (over 5% of fire and rehire calls) industries which were stated by respondents when calling regarding this practice. Similar to the covid question, the human health and social work activities industry were the most discussed (19%).
This was followed by wholesale and retail trade; repair of motor vehicles and motorcycles (13%) and manufacturing (9%). These industries were 17%, 12% and 10% respectively for calls not relating to fire and rehire.
Experience of the helpline
Overall satisfaction
Encouragingly, nearly 19 in 20 (94%) respondents were satisfied with the overall Acas helpline service, with over half (52%) feeling extremely satisfied. Within the 4% dissatisfied, only 1% felt very or 1% extremely dissatisfied.
If we break down satisfaction by number of call attempts to the helpline, when the number of call attempts increases from 1 to 2 to 3, the proportion of those who are extremely satisfied significantly drops from 54% to 33%.
Also, the decrease in overall satisfaction is significant when 4 to 5 call attempts have been made (38% compared to 54% of first-attempt callers) and 6 to 10 call attempts (28% compared to 54% of first-attempt callers).
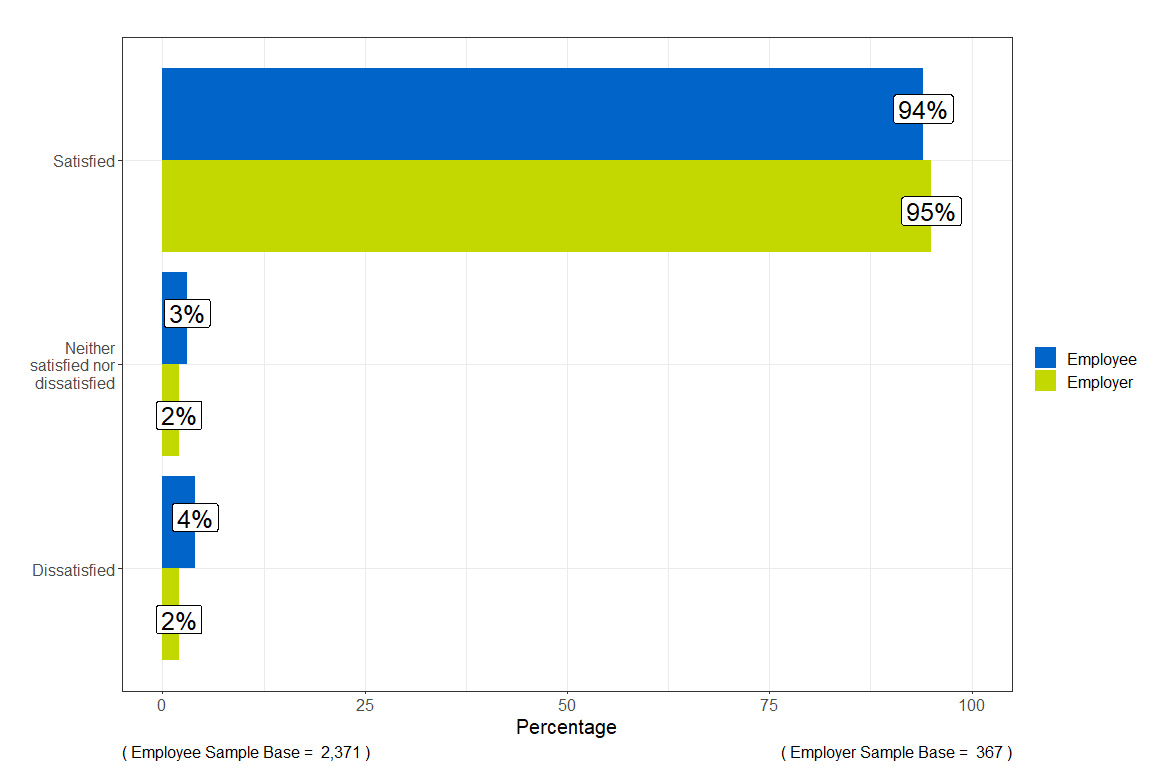
Overall satisfaction: caller type
Looking at satisfaction by caller type, employees and employers have similar levels of satisfaction. 94% and 95% respectively were satisfied (either extremely, very or fairly).
Employers (56%) reported higher levels of being extremely satisfied compared to 51% of employees. However, a 51% proportion of employee respondents being extremely satisfied is still very positive.
Perceptions of the information provided by Acas
Acas's key performance indicator (KPI) for the Acas helpline during the operating year 2021 to 2022 was 'the percentage of users who were able to take clear action following their call to the Acas helpline'. The target was 85%.
This was measured by asking respondents if the information provided helped them decide what to do next. This target was successfully met as 88% agreed that the information provided by the adviser helped them decide what to do next for their query.
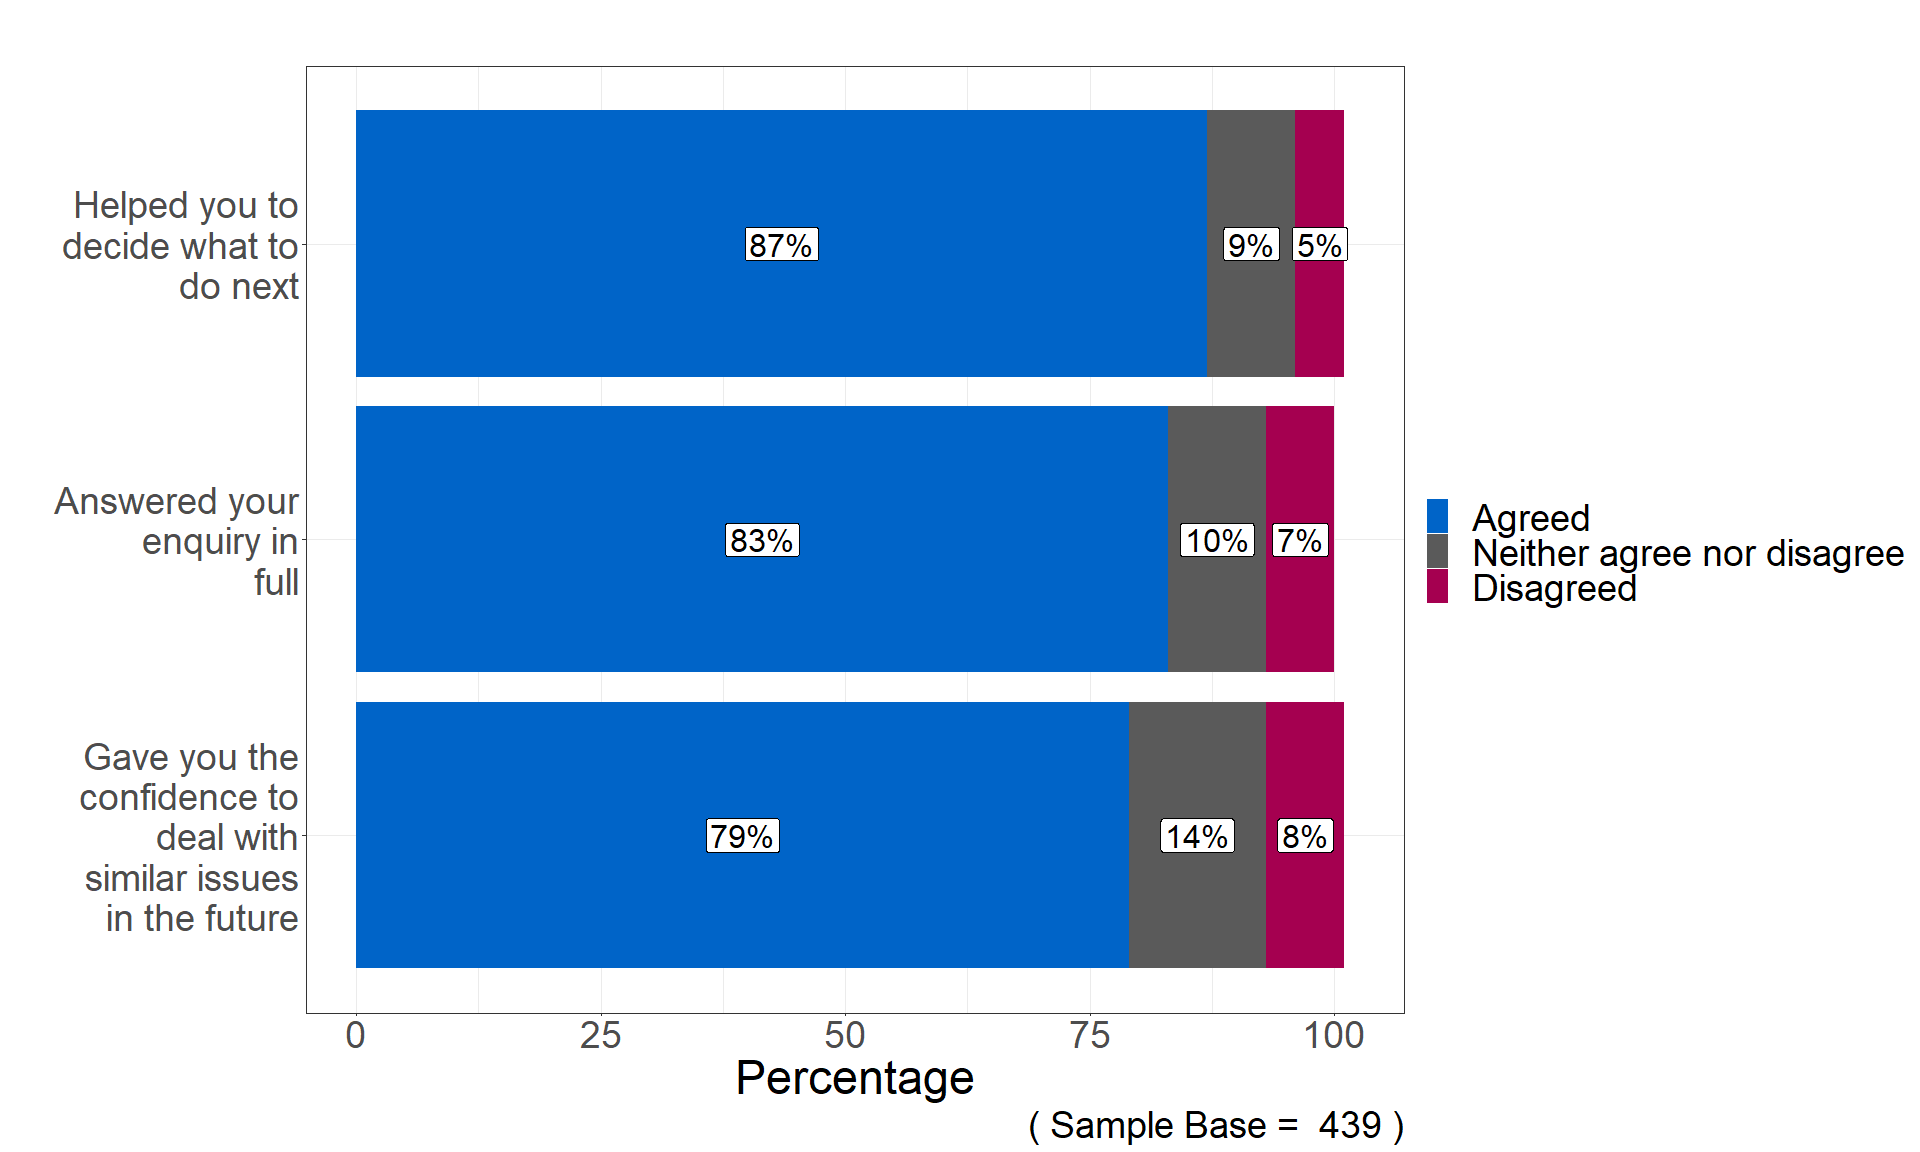
Figure 34 portrays the levels of agreement for 3 statements concerning the perception of the information provided by the helpline. Nearly 9 in 10 respondents agreed the information provided answered their enquiry in full (87%).
There was a slightly lower agreement level (82%) when asked if the information gave them the confidence to deal with similar issues in the future, with 13% stating they "neither agree nor disagree" with this statement.
Perceptions of the Acas adviser
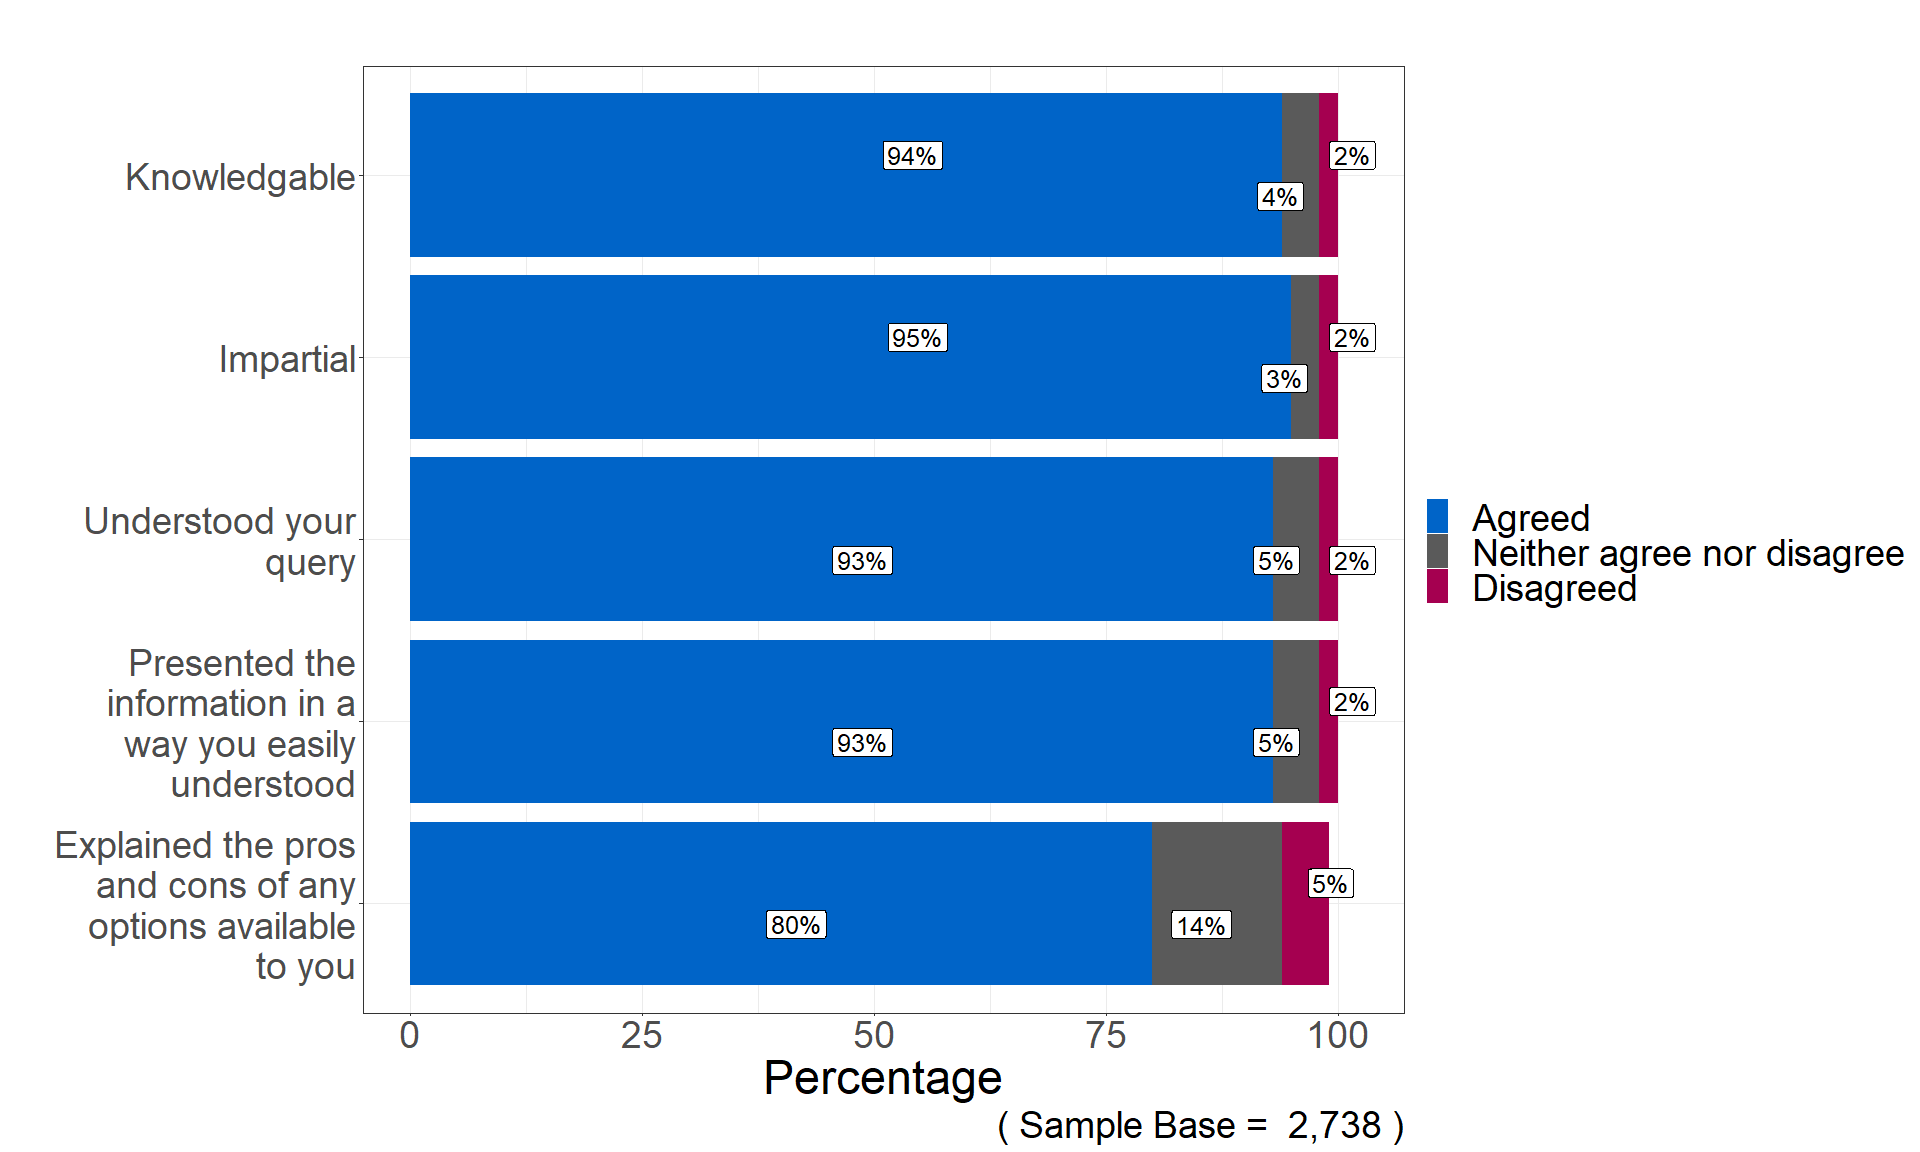
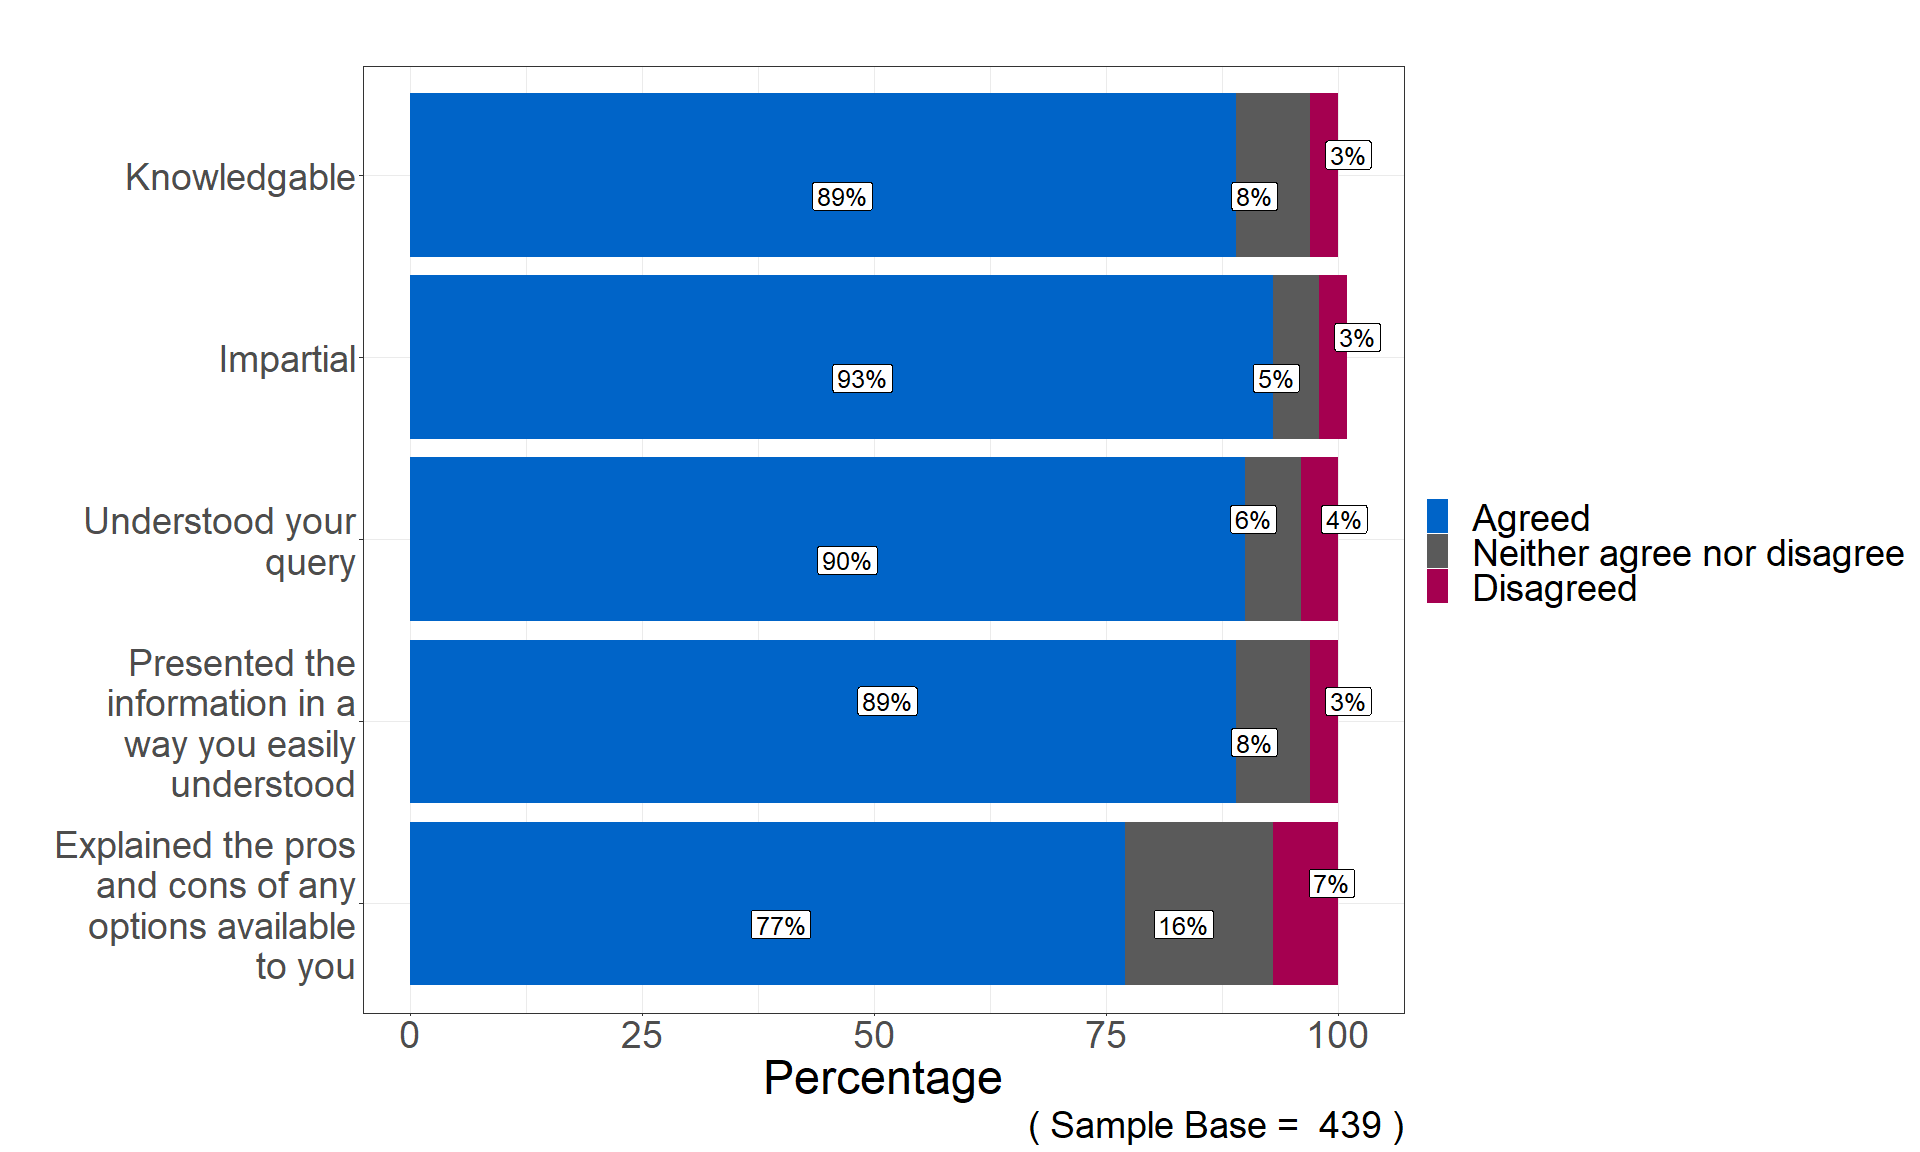
The below portrays the levels of agreement with 5 statements concerning the perception of the Acas member of staff. Respondents agreed the Acas member of staff was knowledgeable (94%), presented the information in an impartial way (95%), understood their query (93%) and presented the information in a way they easily understood (93%).
However, there was a lower agreement level when asked if the adviser had explained the pros and cons of any options available (80%), with 14% stating they "neither agree nor disagree" with this statement. This lower level of agreement may partly be due to some helpline calls not requiring a discussion of the pros and cons of the advice given.
Perceptions of length of call
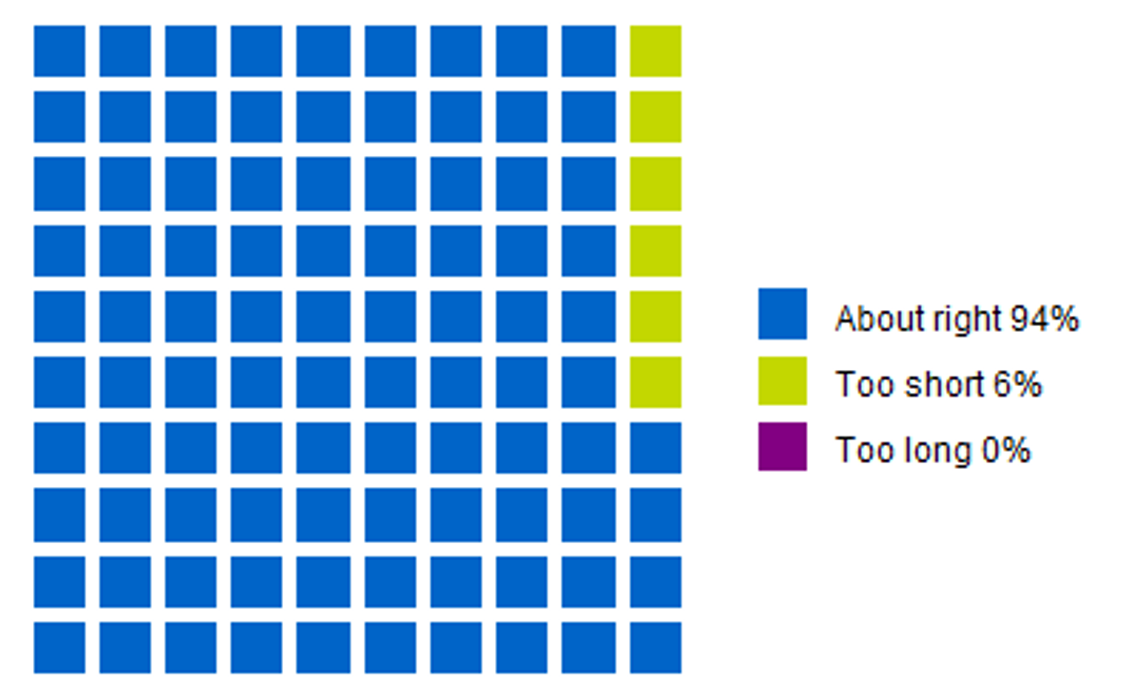
Reassuringly, most respondents felt that the length of the conversation with their helpline adviser was "about right" (94%). 6% of respondents thought the conversation was too short and less than 1% stated the conversation was too long.
Figure 36: 94% of respondents thought the conversation length with the helpline adviser was "about right"
Covid-related overall satisfaction
16% of total respondents stated they were discussing covid.
When the call was discussing covid, the overall satisfaction remained encouraging. The proportion of respondents satisfied with the Acas helpline service was maintained at a high level with more than 18 in 20 (91%), with just under half (47%) feeling extremely satisfied.
However, these satisfaction levels are lower than the calls which were not covid-related where 95% were satisfied and 53% extremely satisfied with the Acas helpline service.
Covid callers were slightly more dissatisfied with the Acas helpline service (5%) compared to 3% for calls not on the subject.
Covid-related perceptions of the information provided by Acas
In regard to the key performance indicator (KPI) for the Acas helpline, "the percentage of users who were able to take clear action following their call to the Acas helpline", the target of 85% was met when the call was discussing covid. 87% agreed that the information provided by the adviser helped them decide what to do next for their query.
Figure 38 portrays the levels of agreement with 3 statements concerning the perception of the information provided by the helpline when the call was discussing covid. Just more than 8 in 10 respondents agreed the information provided answered their enquiry in full (83%).
There was a lower agreement when asked if the information gave them the confidence to deal with similar issues in the future (79%) compared to 83% for calls not on the subject.
Covid-related perceptions of the Acas adviser
Furthermore, when the call discussed covid, there were high agreement levels that the Acas member of staff was knowledgeable (89%), presented the information in an impartial way (93%), understood their query (90%) and presented the information in a way they easily understood (89%).
However, there was a lower agreement level when asked if the adviser had explained the pros and cons of any options available (77%), with 16% stating they "neither agree nor disagree" with this statement. Once again, this lower level of agreement may partly be due to some helpline calls not requiring a discussion of the pros and cons of the advice given.
Fire and rehire related overall satisfaction
5% of total respondents stated they were discussing the fire and rehire practices. Due to the small sample size, the below findings on calls on this topic, and any comparisons to the overall review findings, should be treated with some caution.
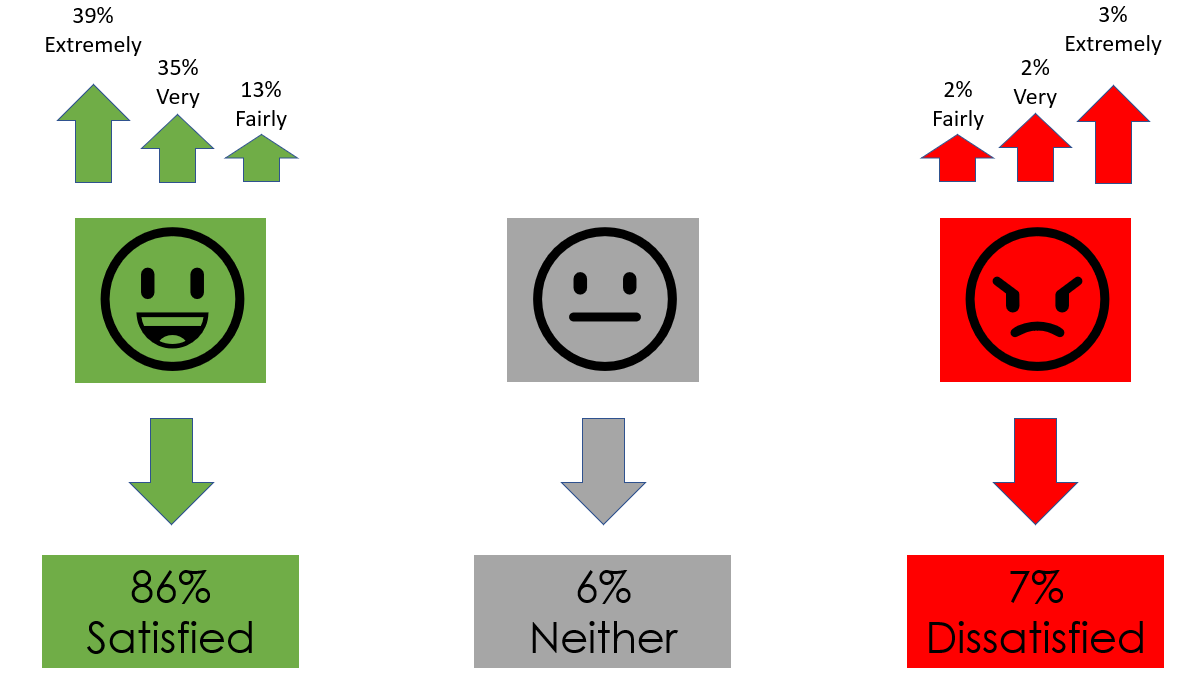
Although still relatively high, there was a decrease in satisfaction levels when the call was discussing fire and rehire practices, compared to levels of satisfaction for calls not on this subject (95%), as more than 8 in 10 (86%) respondents were satisfied with the helpline service on this topic, with 39% feeling extremely satisfied. Within the 7% dissatisfied, 2% felt very and 3% extremely dissatisfied.
Fire and rehire related perceptions of the information provided by Acas
In regard to the key performance indicator (KPI) for the Acas helpline, "the percentage of users who were able to take clear action following their call to the Acas helpline", the target of 85% was not met when the call was discussing fire and rehire with respondents stating the information provided "helped them decide what to do next" having an agreement level of 77%.
Additionally, 17% stated they "neither agree nor disagree" with this statement. As above, some caution should be exercised with the percentages given due to the small sample size for the topic.
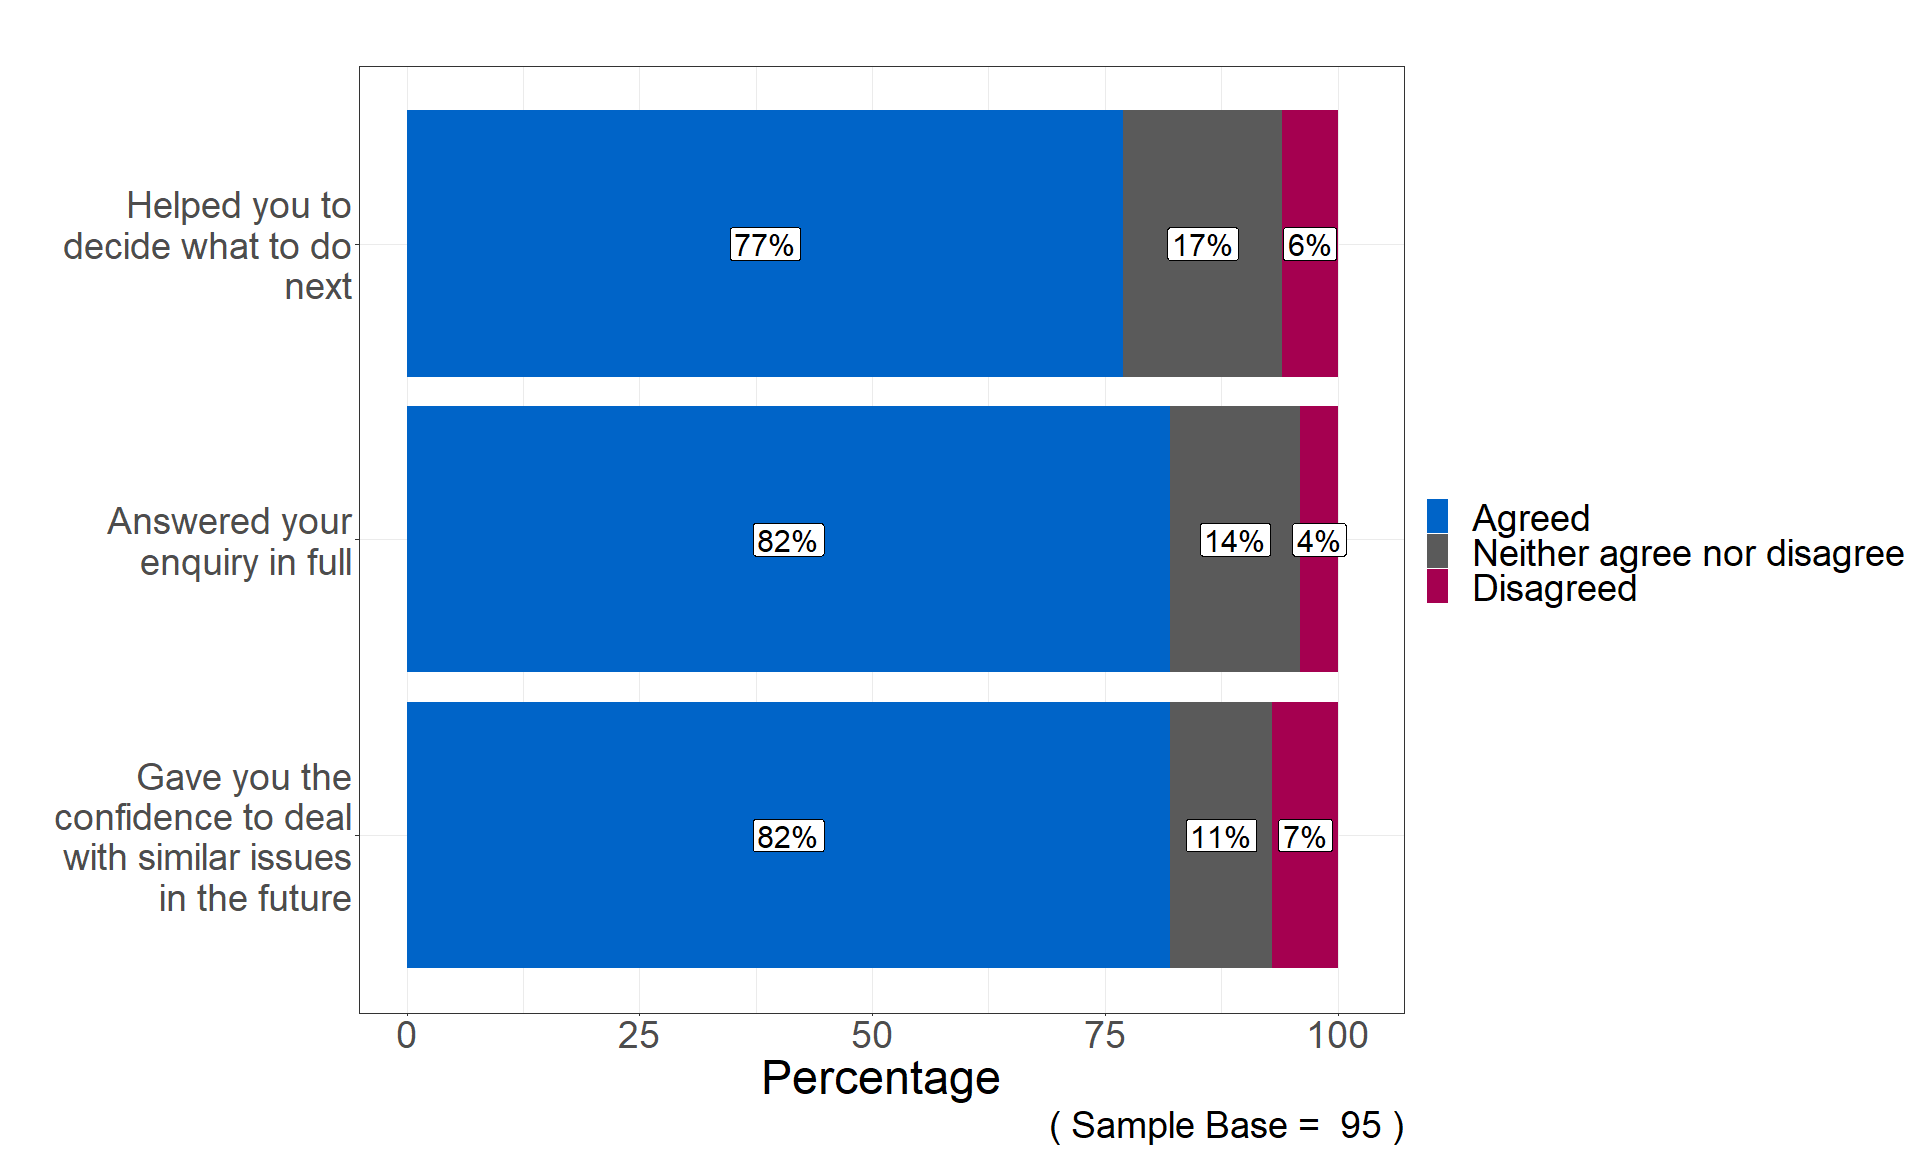
Figure 41 portrays the levels of agreement with 3 statements concerning the perception of the information provided by the helpline when the call was discussing fire and rehire. Just more than 8 in 10 agreed the information provided answered their enquiry in full (82%) and the information gave them the confidence to deal with similar issues in the future (82%).
These levels of agreement were lower than for calls not discussing fire and rehire, which were 87% and 83% respectively.
Fire and rehire related perceptions of the Acas adviser
Furthermore, when the call discussed fire and rehire, more than 18 in 20 respondents agreed the Acas member of staff was knowledgeable (94%), presented the information in an impartial way (93%) and understood their query (94%).
The lowest agreement level was when asked if the adviser had explained the pros and cons of any options available (76%), with 16% stating they "neither agree nor disagree" with this statement. Once again, this lower level of agreement may partly be due to some helpline calls not requiring a discussion of the pros and cons of the advice given.
However, there were lower levels of agreement when respondents were asked if they were presented the information in a way they easily understood (86%) during a call involving fire and rehire.
Call outcomes and next steps
Action taken as a result of calling the helpline
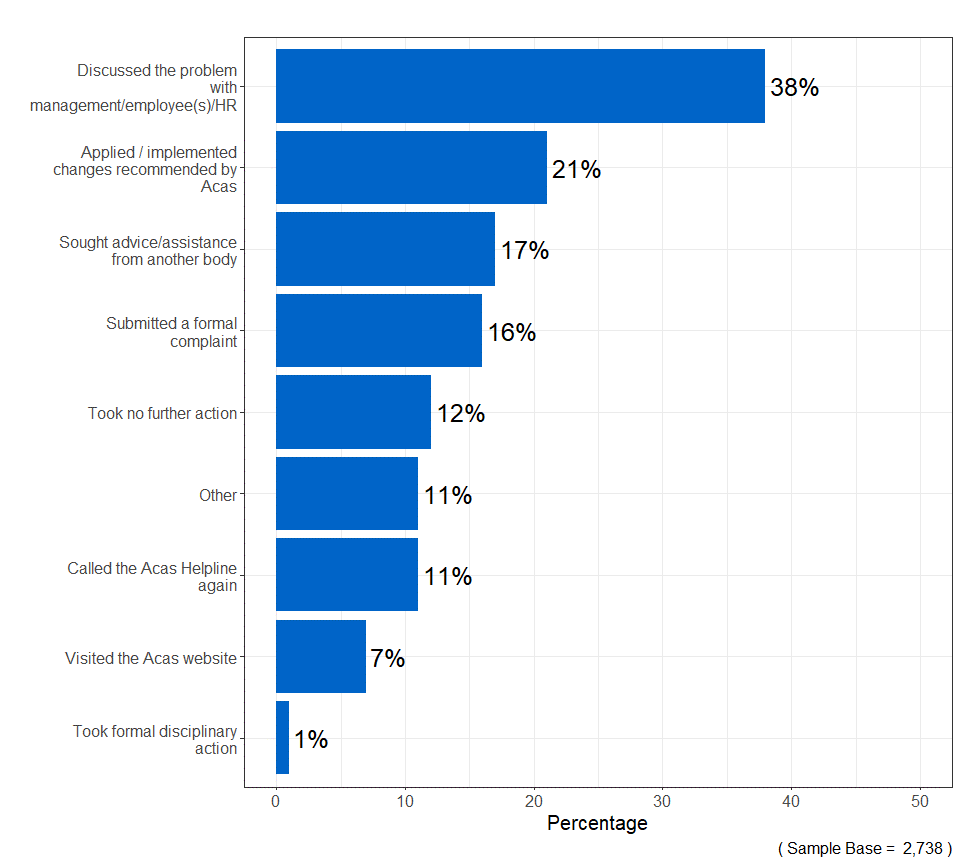
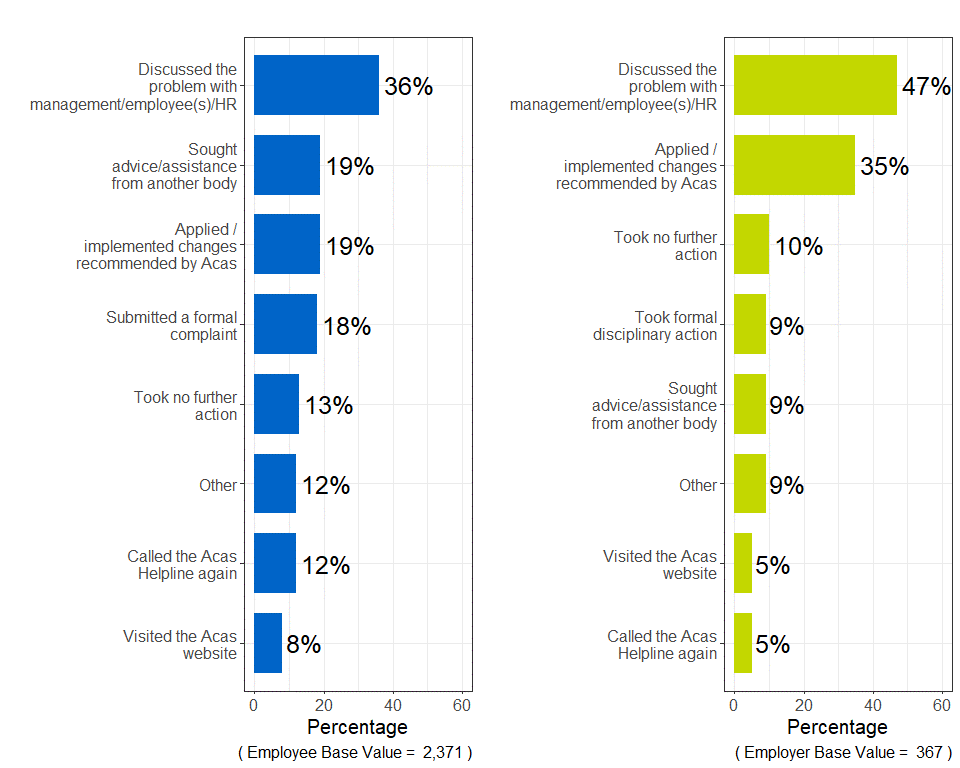
Respondents were asked what further action they had taken following their call to the Acas helpline. They were able to select multiple responses from a provided list. 88% of respondents took some form of action as a result of their call to the helpline.
The most frequent response was discussing the problem with management, employees or HR, with just under 4 in 10 (38%) respondents taking this action. Employers (47%) were significantly more likely to have taken this action than employees (36%).
The second most frequent action of total respondents was they had applied or implemented changes recommended by Acas (21%). There was a statistically significant difference between caller types as 35% of employers took this action compared to 19% of employees. This could be expected as employer callers would be more likely to have powers to implement change in their workplace.
Overall, 17% sought advice from another body. Employers (9%) being significantly less likely to take this action than employees (19%).
The proportion of those calling the Acas helpline again is around 1 in 10 (11%) for all respondents. Employees were significantly more likely to call the helpline again (12%) compared to employers (5%).
Advice sought after calling the Acas helpline
The table below summarises the different sources used by the 479 respondents who sought further advice after calling the Acas helpline. The table breaks down the respondents by caller type. The respondents could choose more than one response.
The most common source of additional advice was a lawyer or solicitor, cited by 42% of all respondents and by both employees (42%) and employers (33%). The second most popular response for employees were the trade union or a trade union representative (30%).
For employers, the second most frequent responses were "the GOV.UK website", "other governmental department website" and "someone at my company or organisation", all cited by 21% of this caller type.
Table 5: 42% of respondents who subsequently sought advice after calling the Acas helpline contacted a lawyer or solicitor
Percentages of peoples, bodies or websites for respondents who subsequently sought advice after calling the Acas helpline.
| People, bodies or websites | Total: where sought advice after calling the Acas helpline (n = 479) | Employee: where sought advice after calling the Acas helpline (n = 446) | Employer: where sought advice after calling the Acas helpline (n = 33) |
|---|---|---|---|
| Lawyer or solicitor | 42% | 42% | 33% |
| Trade union or trade union representative | 28% | 30% | 0% |
| GOV.UK website | 22% | 22% | 21% |
| Citizens Advice website | 19% | 20% | 0% |
| Someone at my company or organisation, for example colleague, manager, internal HR | 18% | 17% | 21% |
| Other | 15% | 15% | 15% |
| Other government department website, for example HMRC, DWP, HSE | 12% | 11% | 21% |
| Online publications, articles or blogs | 10% | 11% | 21% |
| Citizens Advice office visit | 8% | 9% | 0% |
| Don't know or can't remember | 1% | 2% | 0% |
| External HR adviser or consultancy | 1% | 0% | 18% |
| Online HR resource, for example XpertHR | 1% | 0% | 12% |
| Professional network or organisation, for example CIPD | 1% | 0% | 18% |
| Employer association website or other form of advice | 0% | 0% | 6% |
| Social media, for example LinkedIn, Twitter, Facebook | 0% | 0% | 0% |
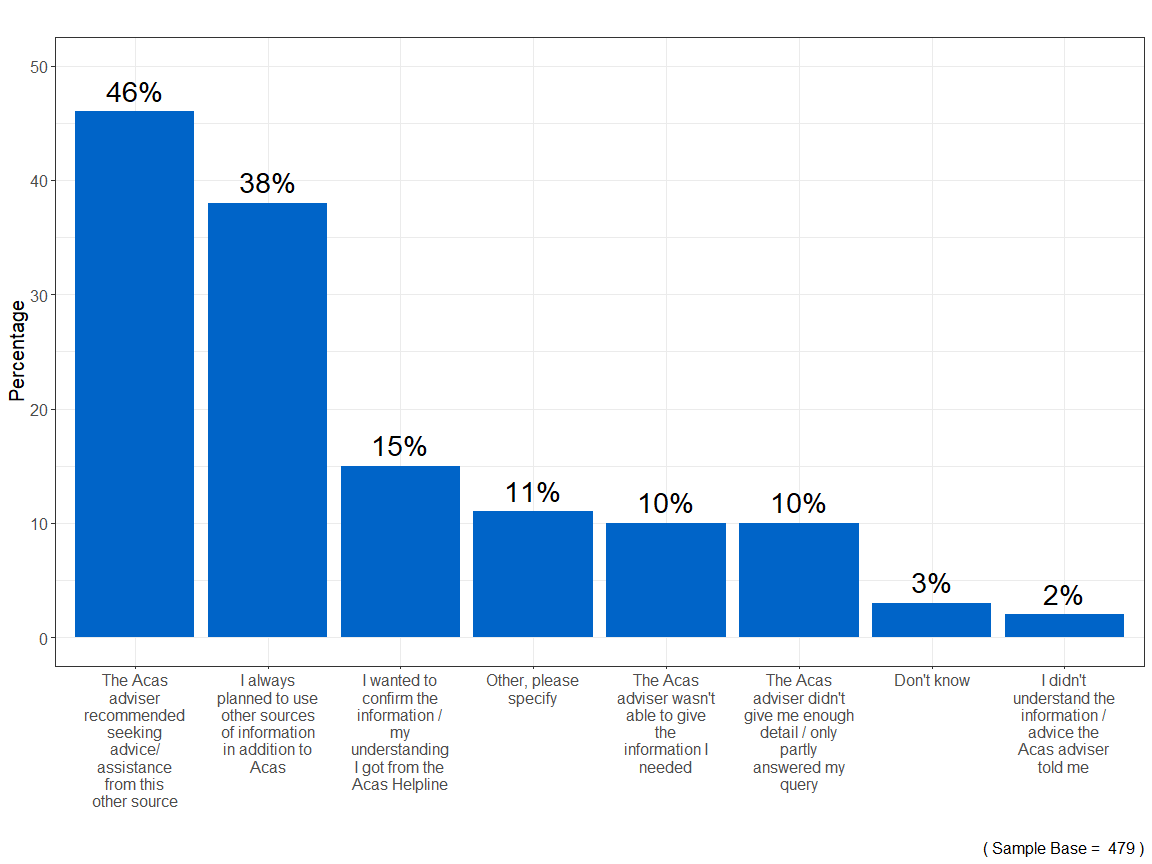
Reasons for seeking additional advice after calling the Acas helpline
More than 4 in 10 respondents (46%) who sought additional advice or assistance from another body did so on the recommendation of the helpline adviser. 38% stated they had always planned to use other sources of information in addition to Acas.
Overall, only 2% of those who sought additional advice stated they did not understand the information or advice given by the Acas adviser.
While employers were significantly less likely to look for additional advice after calling the helpline, when they did, they were significantly more likely to say it was because the Acas adviser was not able to give them the information they needed (30%) compared to employees (8%).
Workplace changes as a result of calling the Acas helpline
Employers were asked whether the workplace discussed with the helpline had updated or introduced any policies as a result of their call to the helpline.
1 in 5 (20%) stated that their workplace had introduced or updated policies as a result of the call. A further 35% stated that while their workplace had not updated or introduced any policies as a result of their call they did intend to do so.
30% of employers stated they did not intend to update or introduce policies as a result of calling the helpline and 15% did not know.
Employment tribunal claims
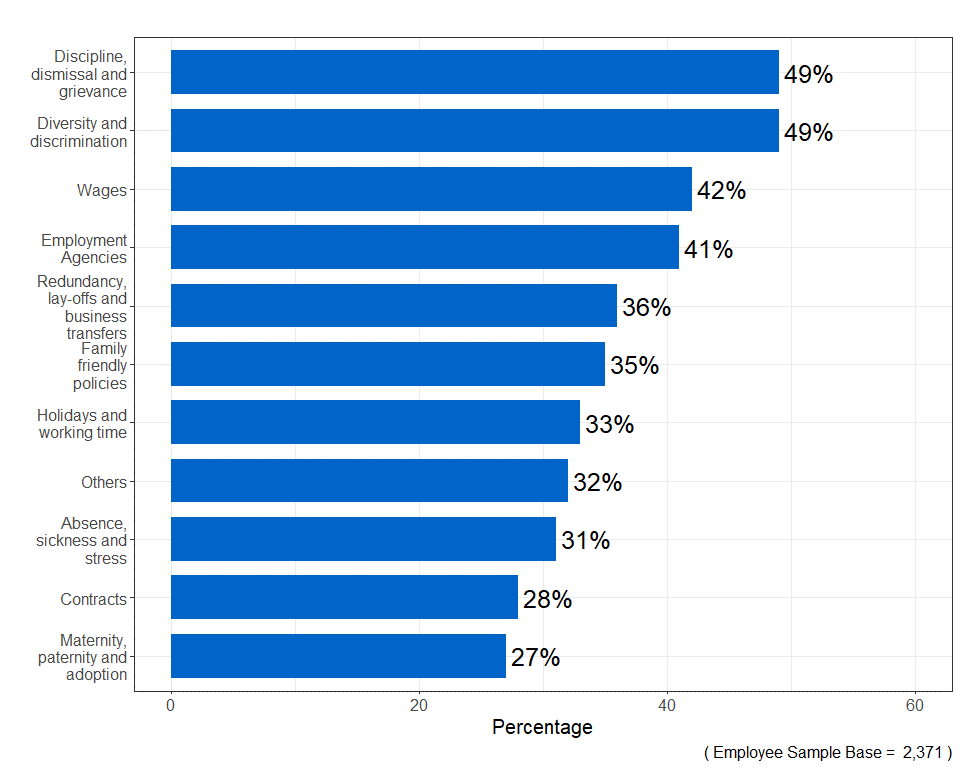
More than a third of employees (35%) had been thinking about making a claim to an employment tribunal prior to calling the Acas helpline.
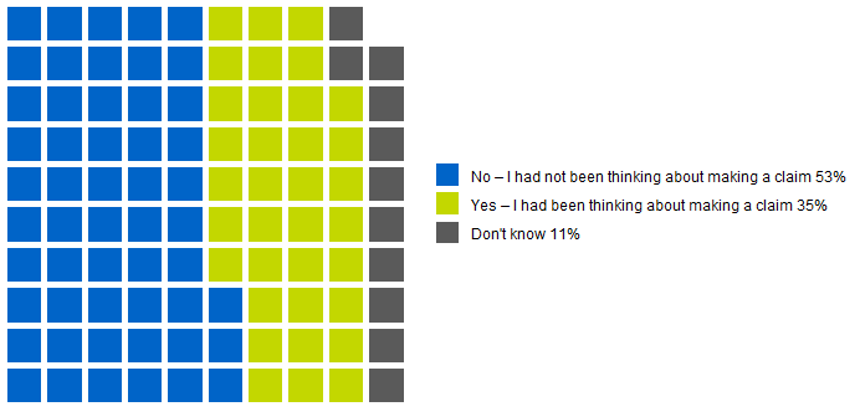
Employees calling the helpline regarding discipline, dismissal and grievance (49%) or diversity and discrimination (49%) were more likely to be thinking about making a claim to an employment tribunal or submitting an early conciliation notification of a claim to Acas.
At the time of completing the survey, 84% of employees stated that they had not yet made a claim to the employment tribunal or submitted an early conciliation notification of a claim to Acas. However, 47% of those were thinking about doing so.
Those calling regarding wage-related issues (29%) were more likely to have made a claim to an employment tribunal or submitted an early conciliation notification of a claim to Acas than other subject matters.
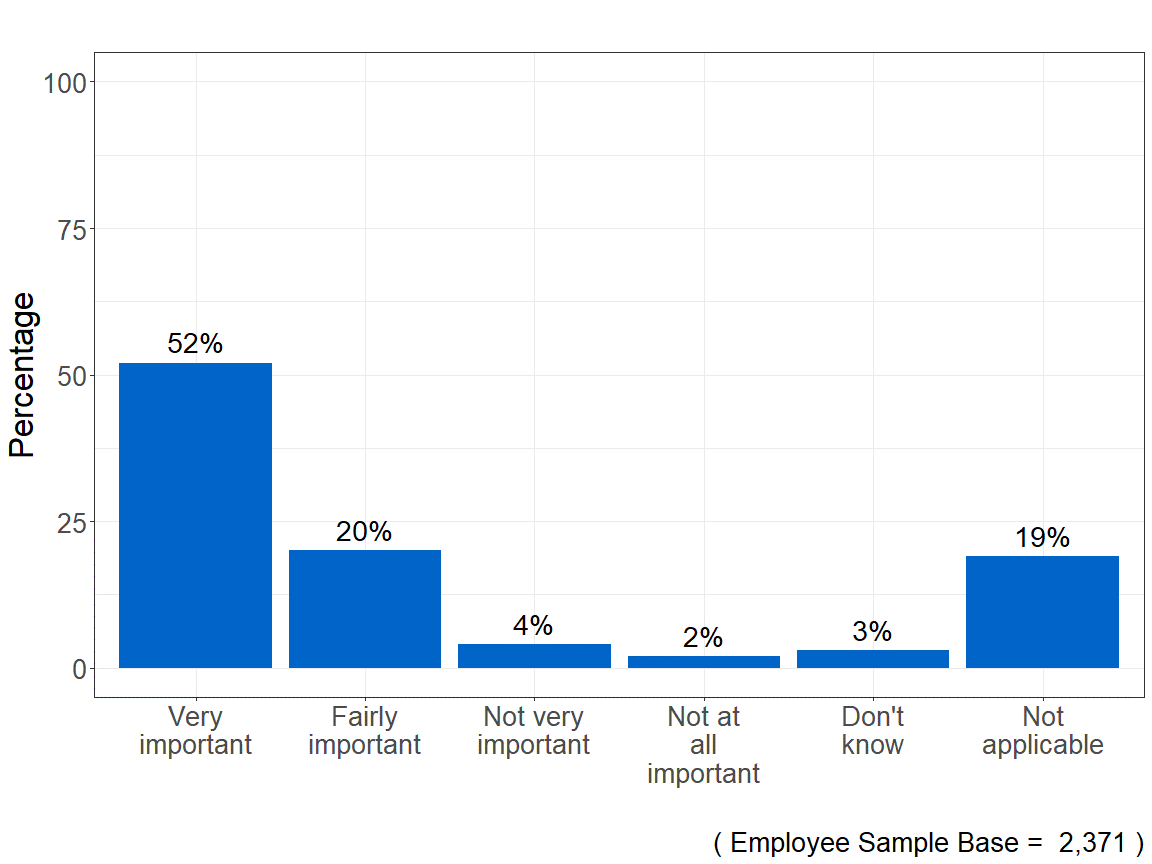
More than 7 in 10 (72%) employees felt their call to the Acas helpline was important in their decision about whether to make a claim to an employment tribunal, with over half (52%) feeling it was very important. Only 6% felt the helpline call was "not very important" (4%) or "not at all important" (2%).
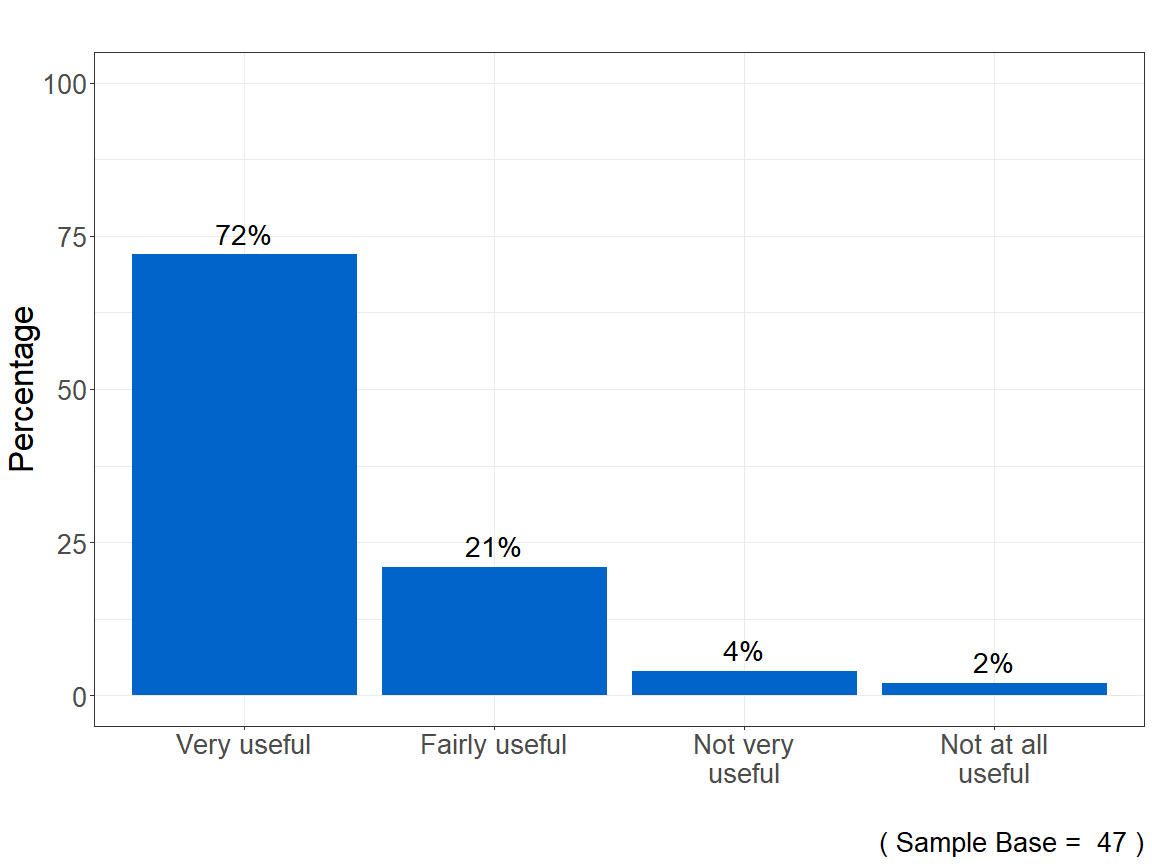
Of those employers with concerns about a potential tribunal situation, 72% felt their call to the Acas helpline was "very useful" in helping them deal with the situation in question, with a further 21% stating it was "fairly useful". Only 6% felt their call was not useful.
Conclusion
Who is using the Acas helpline
In total, 2,738 respondents completed the Acas helpline survey. The majority of respondents had called the helpline as an employee, former employee or on behalf of an employee or former employee ('employees' group) (87%). While 13% were calling as an employer or manager, or on behalf of an employer or manager ('employers' group). 80% of employee respondents were either in full-time or part-time employment.
Overall, the respondents were more likely to be calling from large enterprises (30%) rather than micro (21%), small (21%) or medium-sized enterprises (16%). Interestingly, employers (82%) were significantly more likely to be from a micro, small and medium-sized enterprise (SME) compared to employees (54%). Contrarily, employees (32%) were significantly more likely to state they were from large enterprises than employers (15%).
The industry with the highest proportion of callers was the human health and social work activities industry, for both the employees (19%) and employers (16%).
Of the 1,715 respondents who disclosed their sex, most employees and employers calling the helpline were female (61% and 73% respectively). The mean age of respondents was 48 years and more than 8 in 10 (81%) identified as being from a white ethnic background.
Journey to the helpline
Encouragingly, one third of respondents became aware of the helpline through a recommendation from a friend or family member (33%). The second most popular response was that respondents found out about the helpline through the Acas website (23%).
Just below half of the respondents (45%) visited the Acas website before calling the helpline. The most frequent response from respondents for not visiting the website was they preferred to speak to an adviser (42%).
Furthermore, nearly half of respondents (49%) who called the helpline after visiting the Acas website said it was because they only found partial answers to their question and they needed more information.
Accessing the helpline
The helpline was shown to be easily contactable with respondents stating 87% of the time that they reached the helpline on their first call attempt. Additionally, upon reaching the helpline, more than 19 in 20 (96%) respondents were satisfied (either "extremely", "very" or "fairly") with the length of time to answer their call.
Reason for the call
Overall, the most common topics covered were discussing either a discipline, dismissal and grievance (35%) or a contracts subject (30%).
16% of calls to the helpline related to covid. The "human health and social work activities" industry was the most frequent (21%) when the helpline call involved discussing a covid issue.
Both employees and employers were asked about the potential workplace problems when normal business resumes and lockdown eases or ends. Employees raised the potential issues surrounding employment working patterns and hours, organisations following correct guidance for the office environment, job losses, mental health implications and vaccination status.
Whilst employers stated themes on potential problems including flexible working and working patterns, employees returning to the office and health and safety in the office environment.
5% of respondents stated the call to the helpline related to the practice of 'fire and rehire' during the period August 2021 to March 2022. Similar to the trends for overall and covid calls, respondents were most frequently from the "human health and social work activities industry" for fire and rehire calls, at nearly 1 in 5 (19%).
Experience of the helpline
The helpline performed extremely well when respondents reviewed its overall customer service. Overall, more than 9 in 10 (94%) respondents were satisfied with the helpline service, with over half (52%) feeling extremely satisfied.
Acas's key performance indicator (KPI) for the helpline, during the operating year 2021 to 2022, was for 85% of users to be able to take clear action following their call to the helpline. The helpline successfully reached this target as overall 88% agreed that the information provided by the adviser helped them decide what to do next for their query.
This was slightly lower at 87% for calls discussing covid and fire and rehire (77%) calls. It should be noted, due to the small sample size of fire and rehire calls, any comparisons should be treated with some caution.
The respondents' perceptions of the Acas member of staff were very positive. Overall, respondents agreed the Acas member of staff presented the information in an impartial way (95%), was knowledgeable (94%), understood their query (93%) and presented the information in a way they easily understood (93%). These levels remained high for covid and fire and rehire calls.
However, there was room for development when explaining the pros and cons of any options available. The survey results provided an overall lower agreement level when asked if the adviser had explained the pros and cons of any options available (80%), with 14% stating they "neither agree nor disagree" and 5% disagreeing with this statement.
These lower levels of agreement on explaining the pros and cons of any options available were mirrored when the call related to covid (77%) and fire and rehire (76%). This lower level of agreement may partly be due to some helpline calls not requiring a discussion of the pros and cons of the advice given.
Call outcomes and next steps
A further positive result from the survey was that the advice given by the helpline provided information which helped 88% of respondents to take some form of action as a result of their call to the helpline. The most frequent response being discussing the problem with management, employees or HR, with 38% of respondents taking this action.
Of those who sought additional advice after the call, the most common source was a lawyer or solicitor, cited by 42% of respondents. More than 4 in 10 respondents (46%) who sought additional advice or assistance from another body said they did so on the recommendation of the helpline adviser.
Only 2% of those who sought additional advice did so because they did not understand the information or advice given by the Acas adviser.
More than a third (35%) of employee respondents had been thinking about making a claim to an employment tribunal or submitting an early conciliation notification of a claim to Acas before calling the helpline.
At the time of completing the survey, 84% of employees stated that they had not yet made a claim to the employment tribunal or submitted an early conciliation notification of a claim to Acas, although 47% of those were thinking about doing so. 52% of employee respondents felt the helpline was very important in helping them decide whether to make a claim.
55% of employers introduced or updated policies or procedures, or intend to, as a result of their call to the helpline. Additionally, 72% of employers concerned with a possible tribunal situation felt the helpline was very useful in helping them deal with the issue.
Technical annex
Methodology
A systematic sampling was adopted to offer 1 in 15 helpline callers to participate in the online questionnaire. If the caller agreed, the helpline adviser would collect their email address.
A subsequent email containing a unique link to the online questionnaire was sent to the helpline caller. These were followed by 2 email reminders, to non-respondents, 3 days and 7 days after the initial contact.
During this period:
- 33,976 helpline callers were invited to take part in the helpline survey
- of those, 19,779 (58%) agreed to take part in the survey and provided an email address for the survey invite
- of those that agreed to take part, completed questionnaires were received from 2,738 callers, this is a response rate of 14%
- of those that agreed to take part, around 11% of the email addresses given were not valid and therefore they could not be contacted for the survey, and 4% started the survey but did not complete it
References
Government Analysis Function, 'Sex and gender harmonisation guidance', 4 September 2019. Accessed 16 December 2022.