
Disclaimer
This is an independent evaluation of Acas digital advice carried out by IFF Research.
The views in this research paper are the authors' own and do not necessarily reflect those of Acas or the Acas Council. Any errors or inaccuracies are the responsibility of the authors alone.
1. Executive summary
Introduction and background
Acas (Advisory, Conciliation and Arbitration Service) provides free, impartial information and advice to employers and employees on all aspects of workplace relations and employment law. Acas offers advice in a variety of forms, including digitally. Acas has recently invested in making this online advice easy to digest and optimal for their users. The advice covers a wide variety of topics, from redundancy and absence to the recently added Coronavirus (COVID-19) support section.
This research builds on an earlier study, conducted in 2018, when Acas evaluated its digital advice to understand the extent to which it was meeting user needs. Since then, Acas has undertaken various improvements to the website and it is critical to re-evaluate how users experience the digital advice.
The key objectives to the 2021 evaluation were to:
- evaluate the quality of and user experience of the digital advice
- evaluate how and why the advice is accessed and how it is used
- evaluate how experience and use of the digital advice differs by characteristics of the user
Throughout this report, findings are compared to the 2018 evaluation to understand if there has been any change in user experience.
The methodology used was quantitative in nature, in the form of a survey. Visitors to the advice pages were shown a 'pop-up' to offer them the opportunity to opt in to the research. One to 2 weeks later, they were invited to complete the survey online, as well as being given the opportunity to complete the survey on the telephone. Fieldwork, including the pop-up, ran from late April to July 2021. A total of 2,850 users opted in to take part in the research and 1,318 users of the advice pages completed the survey (758 online and 560 telephone). A total response rate of 46% of users opting into the research was achieved.
Who is using the advice
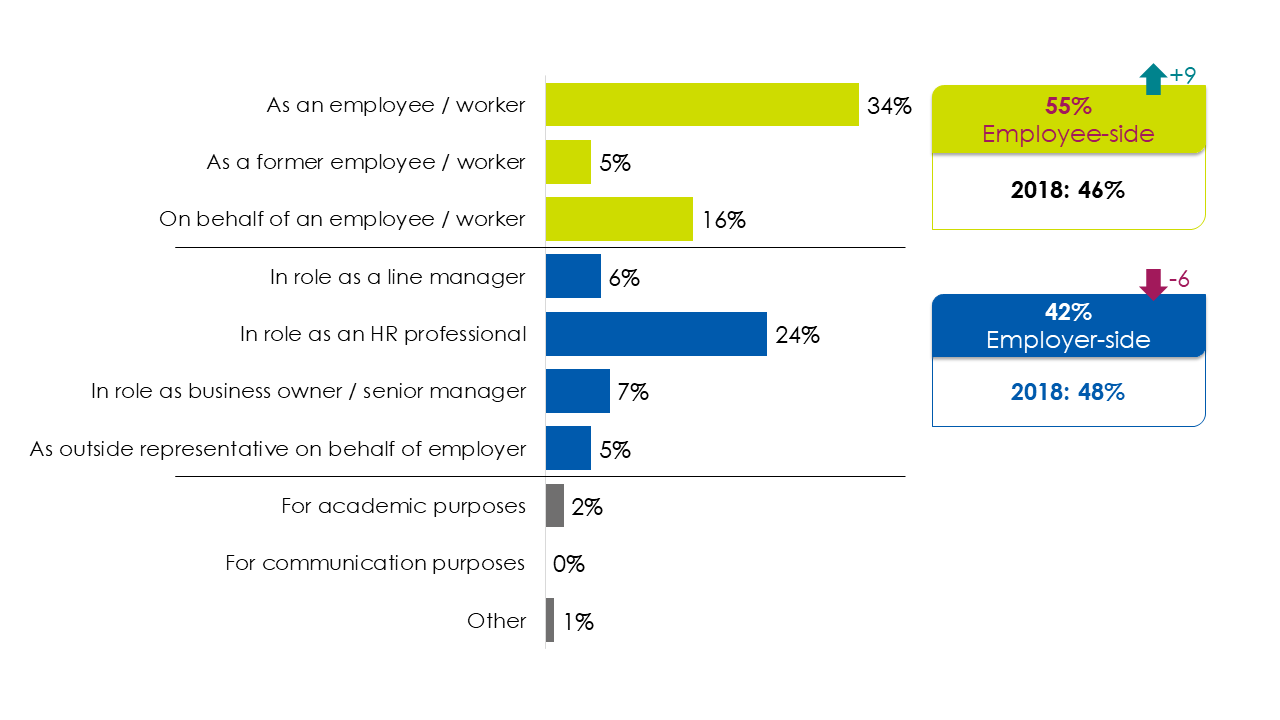
Over half (55%) of users were visiting the advice pages as an employee-side user. This included in the capacity of a current employee, a former employee or on behalf of an employee. This is 9 percentage points higher than in 2018. Conversely, 42% of visitors were using the advice pages as an employer-side user. This was most commonly in their role as an HR professional, followed by as a business owner or senior manager, and as a line manager. The proportion visiting as employer-side users was 6 percentage points lower than in 2018. A small proportion (5%) visited the pages as an outside representative on behalf of an employer. The remaining 3% were looking in another capacity, for example for academic or communication purposes.
This does not necessarily mean fewer employers were using the advice pages compared with 2018; rather the relative proportion of users had changed in favour of employees. April to June 2021 saw an increase in visits to the Acas advice pages, with 3.32 million sessions vs 2.76 million sessions from April to June 2018. This is perhaps to be expected given the impact the COVID-19 pandemic had on the workforce.
Whether users were visiting the advice pages as a third party or on their own behalf was consistent with 2018; 21% visited on behalf of a third party and 78% visited on their own behalf.
In terms of demographics, the majority of users were female (69%), and this was more often the case for employer-side users (78% vs 62% of employee-side users). With regards to age the overall demographic was slightly older than in 2018. The bracket 55+ made up the largest proportion of those accessing Acas advice (47%), followed closely by users in the 35 to 54 age bracket (42%). Those in the youngest age bracket (18 to 34 year olds) made up only 3% of all users accessing Acas advice.
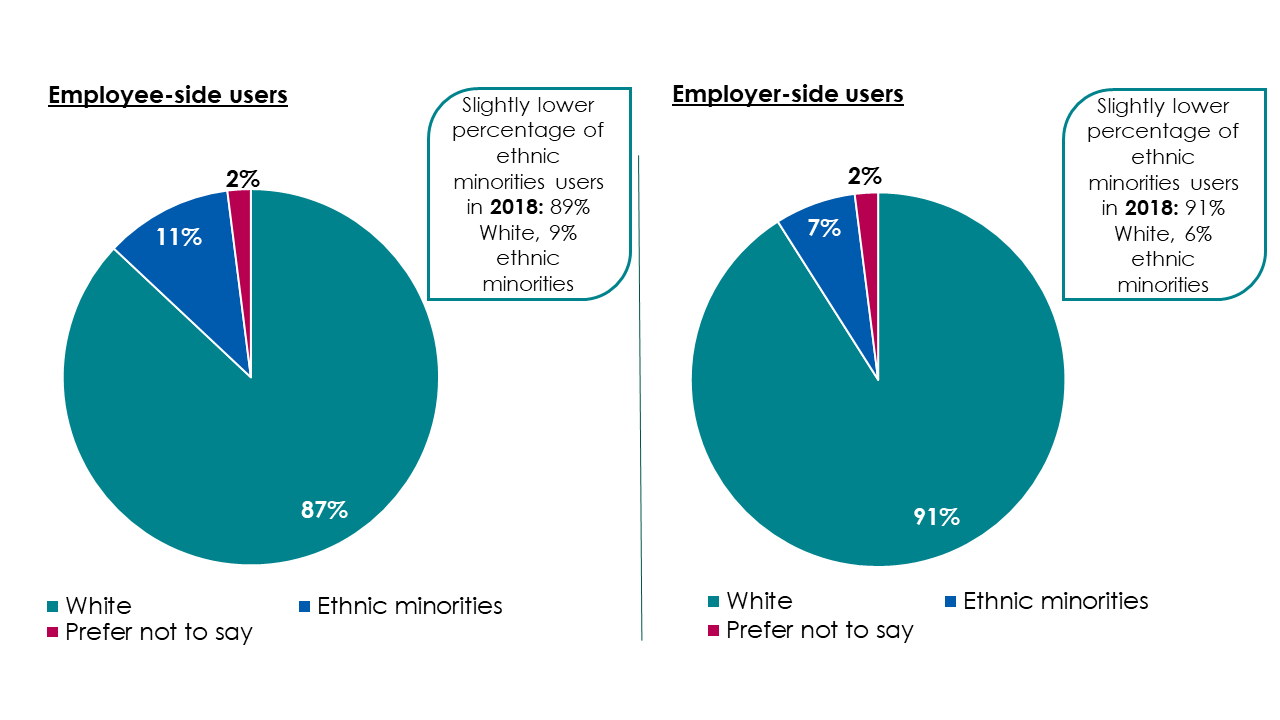
Users were more likely to identify as ethnic minorities compared to 2018 (9% vs 7%), and in 2021, employee-side users were more likely to identify as ethnic minorities than employer-side (11% vs 7%). In 2021 there was an increased percentage of users who had a long-term illness, health problem or disability accessing Acas digital advice consisting of 32% of all users, compared with 25% in 2018. Again, employee-side users were more likely than employer-side users to have a long-term illness, health problem or disability (41% vs 19%).
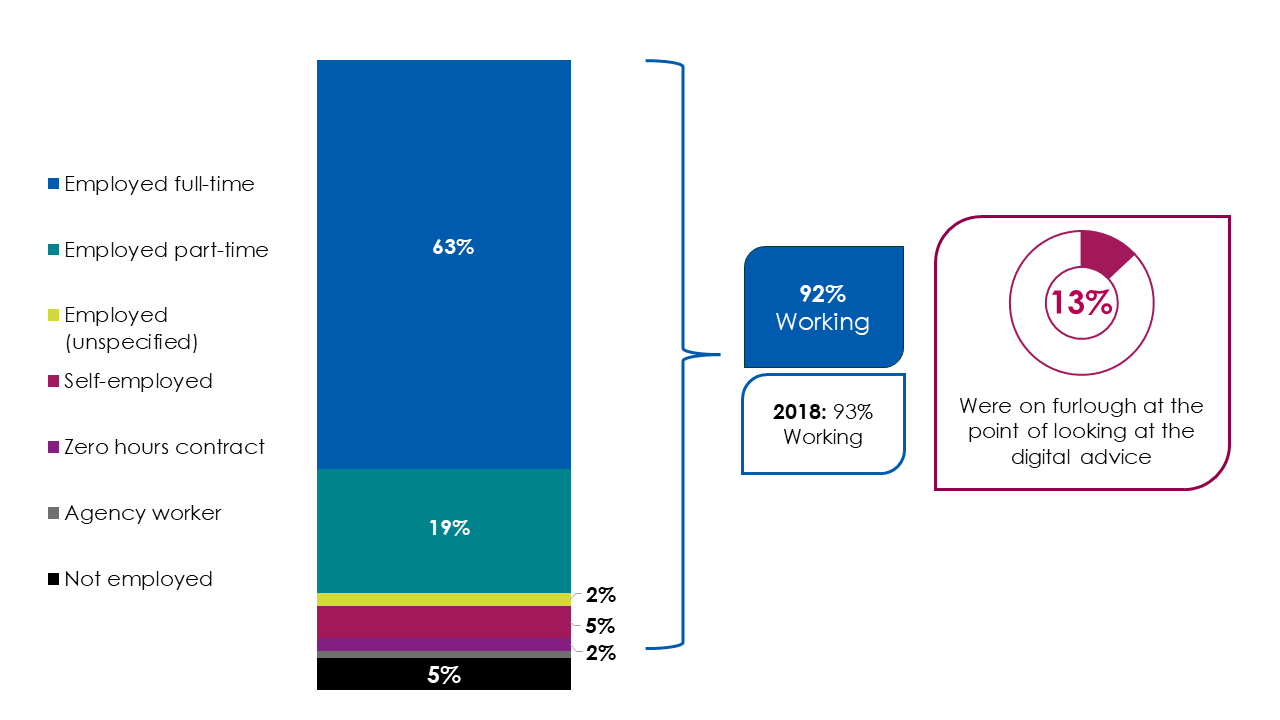
The majority (92%) of all users were working at the time they used the advice pages, in line with 2018. This was more likely to be the case for employer-side users than employee-side users (96% vs 90%). In light of the COVID-19 pandemic, users were asked whether they were on furlough at the point of looking at digital advice; this was the case for 13% of users. Employee-side users were more likely to be on furlough than employer-side (15% vs 11%).
What users were looking for
Users were most often looking for an answer to a specific workplace query (76%), rather than information on a topic more generally (20%). This represented an increase in those looking for an answer to a specific workplace query of 12 percentage points compared with 2018. Employee-side users were more likely to be looking for the former than employer-side (80% vs 72%).
With regards to topic area, the most common main topic looked for was discipline, dismissal and grievance (30%), this had increased by 7 percentage points since 2018. Employee-side users were more likely to name this as their main topic (32% vs 26% of employer-side), as well as diversity, equality, discrimination and bullying (13% vs 6%). Conversely, employer-side users were more likely to name family-friendly and parental rights as their main topic of advice sought after (8% vs 2%).
Separately to the main topic, users indicated whether their query was related to the COVID-19 pandemic. This was the case for almost a quarter of users (23%) and was consistent for both employee-side and employer-side users.
In terms of what users were using the advice for, the main reason was to help solve a problem at work (70%), this was more likely to be the case for employee-side users (76% vs 66%). Users also indicated that they used the website to reassure them of the right course of action and for general information. All 3 of these reasons were more prevalent than in 2018.
User journey
Three-quarters (75%) of users had used the Acas website before, and this was more likely to be the case for employer-side users than employee-side users (93% vs 61%). Employer-side users also had a more historic relationship with the Acas website, with 54% having visited the website for the first time over 5 years ago (vs 22% of employee-side users). Visiting the website longer ago was more common in 2021 than in 2018.
Just over a third (37%) of users went straight to the Acas advice pages, with employer-side users most likely to (40% vs 34%). Others visited GOV.UK first (35%), this was higher than in 2018 (28%). In terms of the route to the advice pages, most commonly, it was via searching for a topic using an internet search engine (39%), an increase since 2018 (31%), closely followed by browsing or searching on the Acas website. The latter was more prevalent amongst employer-side users (48% vs 31% of employee-side).
Digital advice was accessed most commonly through a computer, either work or personal (77%), 17% accessed the advice via their mobile phone and 6% used a tablet. There have been shifts in device usage since 2018, likely due to the COVID-19 pandemic, as more users used their personal computer or mobile phone. Employer-side users were more likely to use their work computer, and employee-side users more likely to name each of the other devices.
The majority of users (83%) felt that the length of the advice was about right, with a decrease since 2018 in those feeling it was too long. Employer-side users were more likely to state that the length was about right (86% vs 80% of employee-side users).
Most users viewed the digital advice 'on-screen' rather than offline, with most reading the information thoroughly on screen or skim-reading the information on-screen. Compared with 2018, fewer users in 2021 printed the information (13% vs 16%). However, every other method for digesting advice was more common in 2021 than 2018. Device used appeared to have a relationship with the way information was digested; those using a computer were more likely to read thoroughly on screen or download or print a PDF.
In terms of the number of sittings and how long users digested the information for, in 2021, more users digested the information over more than one sitting (44%) than in 2018, and more digested the information for over 60 minutes than in 2018. Employee-side users were more likely than their employer-side counterparts to do both of the above.
As well as their digital platform, Acas provides advice in various other ways, such as via its telephone helpline. Generally, however, users did not use other forms of Acas advice (73%), with more not using any other forms compared to 2018. This was more likely to be the case for employer-side users (86% vs 62%). The most commonly mentioned other form of Acas advice used was the Acas telephone helpline (23%), which saw an increase on 2018 and was higher for employee-side users. For those that had called the Acas helpline, this was most commonly after looking at the advice pages (61%), though fewer were doing so only after looking than in 2018. Having said this, more were calling both before and after than in 2018. The main reason for calling the Acas helpline was to confirm the information seen in the digital advice.
Evaluation of experience
The majority of users (84%) found the advice pages easy to access and the majority were also satisfied with the advice (87%), both consistent with 2018. For both measures, employer-side users were more likely to be satisfied, as were repeat users of the website when compared with first-time users. Almost all users stated that they would recommend the advice pages to a friend or colleague and use the advice pages again (95% in both cases). Again, employer-side users were more positive than employee-side users.
There were high levels of agreement with various statements regarding the perceptions and helpfulness of the advice. Users felt the advice was trustworthy (93%), accessible (93%) and presented in a way that was impartial (92%) and easily to understand (90%). In addition, users believed the advice was valuable (88%), up-to-date (86%), helped them decide what to do next (78%) and gave them the confidence to deal with similar issues in the future (76%). Employer-side users were more likely to agree with all statements above than their employee-side counterparts.
There have been significant improvements on a number of these measures since 2018, namely agreement that the advice:
- was presented in an impartial way (an increase of 3 percentage points)
- was valuable (an increase of 3 percentage points)
- helped to decide what to do next (an increase of 4 percentage points)
- gave the confidence to deal with similar issues in the future (an increase of 3 percentage points)
- addressed their enquiry in full (an increase of 4 percentage points)
However, 1 in 6 (16%) users expected to see advice on a topic that was not there when they visited. This was more likely to be the case for employee-side users than employer-side users (20% vs 12%). This was a new question added to the evaluation survey in 2021, therefore, there is no comparable data from 2018. The types of topics mentioned varied from allegations and disciplinary action to information regarding COVID-19. The latter clearly appears to be an area where some users perceive information to be lacking, as those with a query related to COVID-19 were also less likely to feel that the advice gave them the confidence to deal with similar issues in the future, covered topics in sufficient detail and addressed their enquiry in full.
Where users were using the advice to solve a problem at work, in the majority of cases (84%), users reported that it did so to some extent. Similarly, where users visited the pages to reassure them of the right course of action, it almost always did so to some extent (96%). For both of these, employer-side users were more likely to feel it did so than employee-side users.
Action taken following advice
The majority of users took action after using the Acas advice pages, with only 1 in 8 (13%) taking no action. This was consistent for employer and employee-side users and represents an increase in action taken compared with 2018.
The most frequently mentioned course of action by both employer and employee-side users was discussing the problem with management, employees or HR (46% and 56% respectively). Despite being the most common action for both user types, it was more prevalent amongst employer-side users. The second most common action for employer-side users was implementing changes recommended by Acas (42%), whereas for employee-side users, it was seeking advice from another website person or body (32%) and submitting a grievance to an employer (24%).
Where users sought advice from other sources, around a third (35%) visited the GOV.UK website; this was in line for employer-side and employee-side users. There were differences by user type for other sources used, for example, employee-side users were more likely to go to their trade union or representative (51%), lawyer or solicitor (41%), Citizens Advice website (23%) and other government department website (15%). Conversely, employer-side users were more likely to use a professional network or organisation (42%) or an online HR resource (22%).
For those who sought advice elsewhere, the top 3 reasons were to confirm the information (64%), that they had always planned to use other sources (55%) and that there wasn't enough detail (42%). These were all consistent for both employer and employee-side users although employee-side users were more likely to seek further advice as Acas recommended doing so (31% vs 16% employer-side), they didn't understand the information (15% vs 2%) and the advice was hard to navigate (7% vs 2%).
Over a third of users had improved or planned to improve existing workplace policies (37%), which is lower than in 2018. A slightly smaller proportion (30%) of users had implemented or planned to implement new workplace policies, in line with 2018.
Compared to 2018, more employer-side users visited the advice pages due to a concern over employees' claims to the employment tribunal (12%), and more employee-side users made an employment tribunal claim or early conciliation notification after visiting the advice pages (12%).
A smaller proportion of all users passed on the advice when compared with 2018 (43% in 2021 vs 46% in 2018), however, more employer-side users passed on the advice than did so in 2018. There was a large discrepancy between user types and whether they passed the information on (58% of employer-side users vs 32% of employee side users).
2. Introduction and background
Background and objectives
Acas (the Advisory, Conciliation and Arbitration Service) provides free and impartial information and advice to employers and employees on all aspects of workplace relations and employment law. Acas offers a wide and expansive range of official advice to employers and other stakeholders, ranging from HR professionals, owners of businesses, managers, and employees themselves. They offer advice via several channels, one of which is digital. Over the past few years, Acas have invested in making official advice and publications available online in an easy to digest format. This advice covers a wide range of workplace issues, from absence and sickness to contracts and working arrangements and redundancy. In the past year, Acas has also developed a new section on COVID-19 (Coronavirus) support.
In 2018, an evaluation of their digital advice, which was available in both short-form and long-form (such as PDFs), on their website was conducted to understand how well it was meeting user needs. Since then, Acas has undertaken various improvements to the website, and have therefore commissioned an evaluation of this digital advice in 2021.
The key objectives of this research were to:
- evaluate the quality of and user experience of the digital advice
- evaluate how and why the advice is accessed and how it is used
- evaluate how experience and use of the advice differs by characteristics of the user
Throughout this report, findings are compared to the 2018 evaluation to understand if there has been any change in user experience.
Methodology
A total of 1,318 users of the digital advice pages on the Acas website completed a quantitative survey about their experience of using the digital advice, either online or via telephone between May and July 2021.
In order to collect details of users of the Acas digital advice, a pop-up was created to appear on the Acas advice pages once a user had been on the website for 30 seconds. This pop-up collected permission and details of the user, and they were then contacted by IFF Research between 1-2 weeks after visiting the digital advice.
The pop-up was live on the Acas website from 26th April to 5th July 2021, and in this time frame, a total of 2,850 users filled in their details and agreed to be contacted to take part in the research. It is estimated that this was just under 1% of visitors to the advice pages.
Initially, users were contacted by email to take part in the survey online, and a total of 758 users completed the survey in this manner, representing a 27% online response rate. Following this contact, users who were yet to respond were contacted by telephone, of which a further 560 users completed the survey over the phone, giving a telephone response rate of 27% (based on those who had not yet completed online and had a valid telephone number). Note: Total response rate is not the sum of online and telephone due to some users not giving a telephone number or an email address.
In total, the response rate was 46% of those who opted in, participating in the research.
Reporting conventions
Only differences that are statistically significant have been commented upon. A result is statistically significant if it is unlikely to have occurred by chance and it simply means there is statistical evidence of a difference between 2 figures; it does not mean the difference is necessarily large, important, or significant in the common meaning of the word. A statistical difference can still occur if the percentage point change is very small due to the large base sizes included in the dataset. Note: Statistical significance is calculated based on a 95% confidence level.
Throughout this report, comparisons are made between employee-side and employer-side users, based on what capacity users indicated they were visiting the advice pages in:
- employer-side users – respondents who identified themselves as looking for advice either in their role as a 'line manager', 'HR professional', 'business owner or senior manager' or as an 'outside representative looking for advice on behalf of an employer'
- employee-side users – respondents who identified themselves as looking for advice either as an 'employee or worker', 'a former employee or worker', or 'on behalf of an employee or worker'
Findings for each group are compared throughout and flagged where this is statistically significant. In charts, an asterix indicates this difference.
Where comparisons are made between 2018 and 2021, these are marked on charts using arrows showing the direction of change and by how many percentage points.
3. Who is using the advice
This section covers the capacity in which users were visiting the advice pages, as well as their demographic profile and details on their employment status. It also covers the nature of their workplace, including sector and size of organisation.
Key findings
- Employee-side users made up over half of the users who took part in the survey and employer-side users made up 42%. The remaining users were looking for academic or communication purposes.
- There were some key differences in demographics between the 2 user groups. Employee-side users were more likely to be:
- in the 55 years and older age group
- identify as ethnic minorities
- male users
- have a disability
Employer-side vs employee-side users
Users of the advice pages were looking for advice from various perspectives; a third (34%) were looking as an employee or worker and around a quarter looked at the advice in their role as a HR professional (24%). Users were categorised into employee-side and employer-side users, as shown in Figure 3.1 below. Employee-side users made up the largest proportion of users at 55%, which included users who were an employee or worker, a former employee or worker or looking at the advice on behalf of an employee or worker. Employer-side users made up 42% of users and included those in a role as a line manager, HR professional, business owner or senior manager, or as an outside representative on behalf of an employer.
There was a significant change in the percentage of employee-side users (55%) vs employer-side users (42%) compared to 2018, where users were more evenly distributed. Employee-side users were up by 9 percentage points as the most likely type of user to be accessing Acas advice pages, whereas employer-side users were down by 6 percentage points.
This does not necessarily mean fewer employers were using the advice pages compared with 2018, rather that the relative proportion of users had changed in favour of employees. April to June 2021 saw an increase in visits to Acas advice pages with 3.32 million sessions vs 2.76 million sessions from April to June 2018. This is perhaps to be expected given the impact the COVID-19 pandemic had on the workforce.
Users were categorised into those who visited on behalf of a third party (21%) and those who visited on their own behalf (78%). Third party users included those looking on behalf of an employee or worker (16%) and those looking as an outside representative on behalf of an employer (5%). These figures remained broadly consistent with 2018, where 21% of users were looking for advice on behalf of a third party and 79% accessing advice on their own behalf.
Employer-side users were more likely to be visiting Acas on their own behalf than employee-side users (88% vs 72%). For employee-side users, they were most commonly accessing Acas advise for themselves as an employee (62%). They were also more likely to be visiting Acas on behalf of an employee (28% vs 0%) or on behalf of a third party, when compared to employer-side users (28% vs 12%).
Demographics
Gender
The split between male and female users accessing Acas advice pages was broadly in line with 2018, with 31% male users and 69% female in 2021 versus a comparable 29% and 70% in 2018.
As was recorded in 2018, there were significant differences between employee-side and employer-side users when looking at gender. Although users identifying as female made up the largest portion of all users, employer-side users were more likely to be female (78% vs 62%) than employee-side users. Male users were more likely to be employee-side users than employer-side users (38% vs 22%).
In line with 2018, 99% of users reported that the gender they identify with is the same as their sex registered at birth.
Age
Users in the age bracket 55+ made up the largest proportion of those accessing Acas advice (47%), followed closely by users in the 35-54 age bracket (42%). Those in the youngest age bracket (18-34 year olds) made up only 3% of all users accessing Acas advice.
Comparing the breakdown of user age against 2018, there was a higher percentage of users in the 55+ age bracket in 2021 (47% vs 39% in 2018). Previously, the 35-54 age bracket made up the largest proportion of all users in 2018 (54%). In addition, 2018 saw a higher percentage of users in the 18-34 category (7% vs 3%), meaning that there was a slightly younger user profile in 2018 compared with 2021.
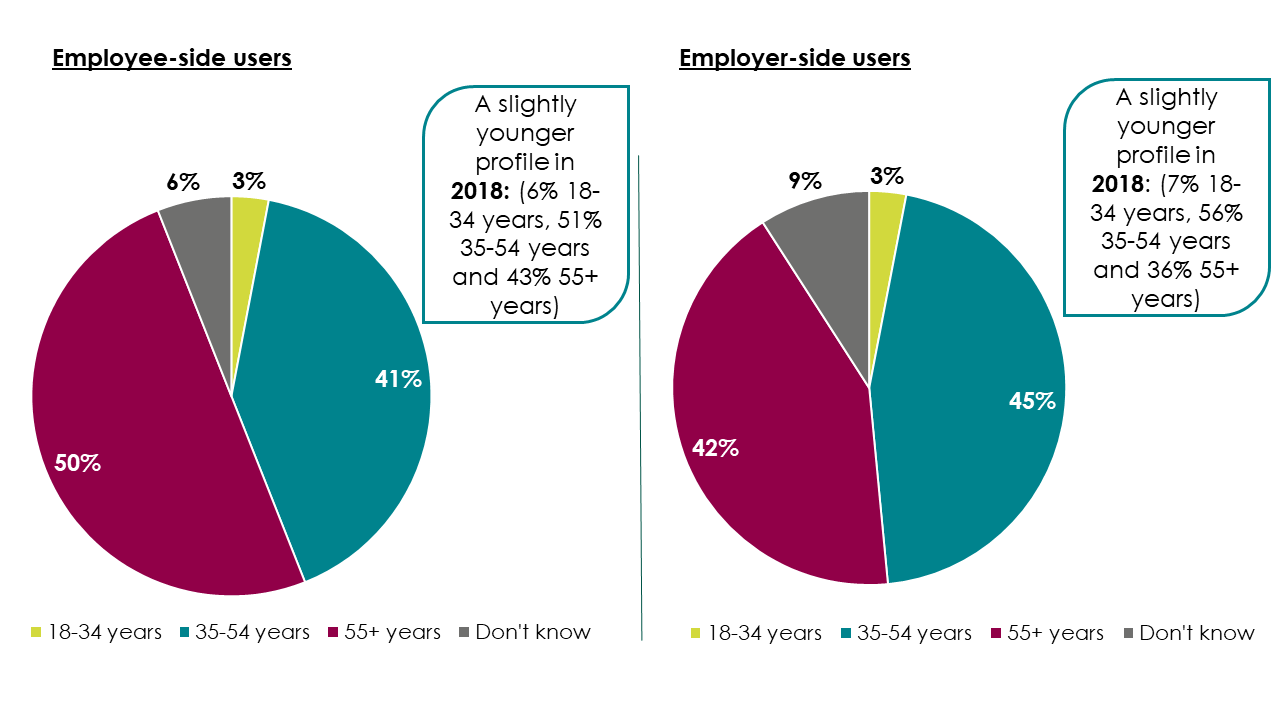
Looking at user age against employee and employer-side users which is described in Figure 3.2, employee-side users were more likely to be in the 55+ age bracket than employer-side users (50% vs 42%). Users who were looking at Acas on behalf of an employee were more likely to be in the 55+ age bracket than any other age bracket (60%), as well as those who were business owners or senior managers (66%). Users looking at Acas advice who were HR professionals were more likely to be between the ages of 35-54 (55%) compared to all other age brackets.
Ethnicity
Considering all users who accessed Acas advice pages, 89% of users identified as white, with 9% identifying as ethnic minorities. Compared with 2018, an increase in ethnic minority users was seen in 2021 (9% vs 7% in 2018).
As can be seen in Figure 3.3 below, employer-side users were more likely to be white (91% vs 87%) compared with ethnic minority users who were more likely to be employee-side users (11% vs 7%). There was a slight increase compared with 2018 in the percentage of ethnic minority employee-side users (11% in 2021 vs 9% in 2018). Users who were business owners or senior managers were most likely to identify as white (90%).
Users identifying as ethnic minorities were more likely to be accessing Acas advice to seek information on diversity, equality, discrimination and bullying than users identifying as white (17% vs 10%).
Disability
In 2021 there was an increased percentage of users who had a long-term illness, health problem or disability accessing Acas advice pages comprising 32% of all users, compared with 25% in 2018.
Looking at these users by their employment user profile, employee-side users were more likely than employer-side users to have a long-term illness, health problem or disability (41% vs 19%). This was a slight increase on 2018, where employee-side users were also more likely to have a long-term illness, health problem or disability, though with 7 percentage points less at 34% vs 18% for employer-side users.
Working status and organisation type
Employment status
Broadly in line with the 2018 survey results, 92% of all users accessing Acas in 2021 were working, compared with 93% in 2018, as can be seen in Figure 3.4 below.
Those who were employed full-time made up the largest proportion of users at 63%, followed by those employed part-time with a share of 19%. The percentage of those employed full-time was 4 percentage points down compared to 67% in 2018.
Employer-side users were more likely to be working than employee-side users (96% vs 90%). The proportion who were employed full-time and part-time was broadly in line with each user type, though employee-side users were more likely to be unemployed (7% vs 2%) and employer-side users were more likely to be self-employed (9% vs 1%).
In light of the COVID-19 pandemic, a new question was added in the 2021 survey to find out the proportion of users who were either on furlough or looking at the advice on behalf of someone who was on furlough. Around 1 in 8 (13%) of all users were on furlough or looking on behalf of someone on furlough at the point of accessing Acas advice. Employee-side users were more likely to be on furlough than employer-side users (15% vs 11%).
Of users that had a query related to COVID-19, 29% were either on furlough themselves or accessing the advice on behalf of someone who was on furlough. Users from the private sector were more likely to be on furlough than those in the public or not-for-profit sectors (16% vs 9% in both the public and not-for-profit sectors).
Organisation size and industry
Users who were in work and accessing the Acas advice pages were most likely to be working for an organisation with 500+ employees (40%) compared with all other organisation size bands. Proportions of users in each organisation size band was broadly consistent with that in 2018, as can be seen in Figure 3.5.
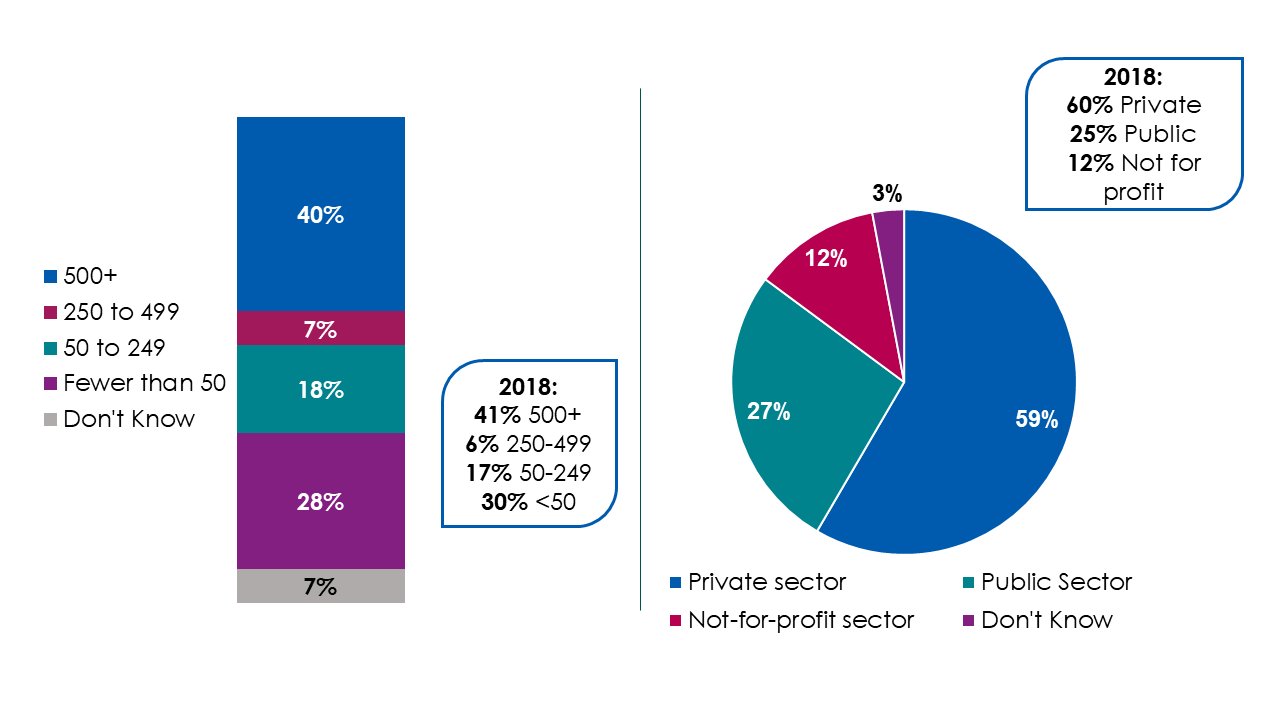
Employer-side users were more likely to be from organisations with fewer than 50 employees (38%) and organisations with between 50 and 249 employees (23%) compared with employee-side users, who were much more likely to be from organisations of 500+ employees (48%).
Looking at which sectors users were working in, the private sector was the most common with 59% of total users working in the private sector at the point of accessing Acas advice. Of those, employer-side users were most likely to be from the private sector (68% vs 53% employee-side), as well as most likely to be from the not-for-profit sector (14% vs 9% employee-side). Employee-side users were more likely than employer-side users to be working in the public sector (34% vs 17% employer-side).
4. What were users looking for?
This chapter aims to understand why users were looking for advice on the Acas website, including exactly what they wanted to get information on and the reason for this. Specifically, new to the 2021 evaluation is the exploration of the nature of COVID-19 queries.
Key findings
- More users in 2021 were looking for advice in response to a specific query, rather than to find more general information.
- Employee-side users were more likely to be looking for advice on a specific workplace query than employer-side users.
- In addition, more users in 2021 were using the advice to solve a problem at work or reassure them of the right course of action.
Reason for looking at Acas digital advice
Three-quarters (76%) of all users visited the Acas digital advice pages with a specific workplace query that they wanted to find the answer to. A smaller proportion (20%) had visited the advice pages to get information about a particular topic more generally.
Compared to 2018, more users in 2021 were looking for a specific workplace query (76% in 2021 vs 64% in 2018), rather than finding out more generally about a topic (20% in 2021 vs 30% in 2018). Just 3% of all users in 2021 were browsing the internet or Acas website and came across the advice pages without having sought out a particular topic or query. This is illustrated in Figure 4.1.
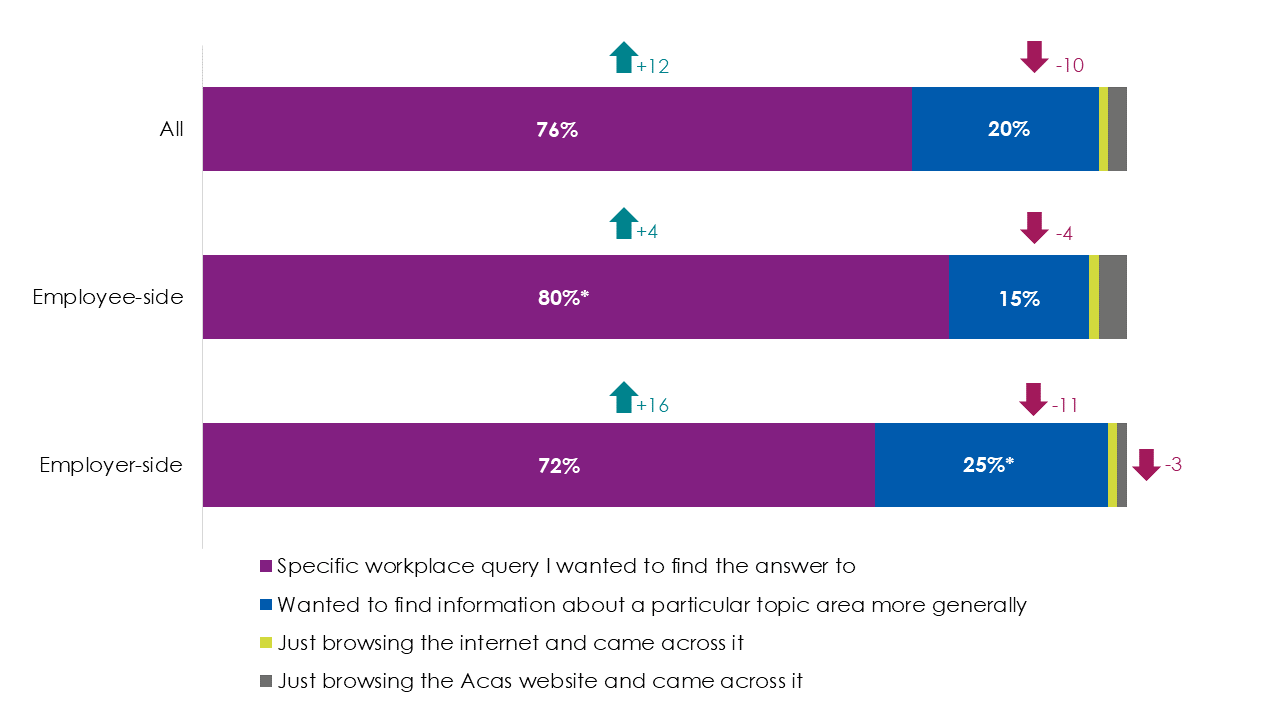
Both employee-side and employer-side users most commonly cited that they visited the website with a specific workplace query they wanted to find the answer to. However, there were differences between the 2 user groups; employee-side users were more likely to have visited the advice pages with a specific workplace query that they wanted to find the answer to (80% vs 72% of employer-side users). By contrast, employer-side users were more likely than employee-side users to have visited the advice pages for information about a particular topic more generally (25% vs 15% of employee-side users). Furthermore, those visiting the advice pages on their own behalf were more likely to have had a specific workplace query than those visiting on behalf of a third party (77% vs 71% respectively).
Users who had visited the Acas website before were more likely than first time users to have wanted to find information about a particular topic area more generally (23% vs 13% of first-time users). Meanwhile, users who accessed the advice pages via a mobile or tablet were more likely to have had a specific workplace query (83% vs 74% of those that used a computer). However, this may be partly due to the majority of mobile/tablet users being employees (who were the most likely to have had a specific workplace query).
Topics of Acas digital advice
Acas digital advice is presented across approximately 75 guides covering different aspects of employment law, best practice and resolving workplace conflict. These guides are all accessed under the 'Advice' section of the Acas website. For the purposes of analysis, these guides were synthesised into a smaller number of overarching topic areas (which are shown in Figure 4.2). Users who completed the survey indicated all of the topic areas they looked for information on, as well as the main topic.
The most common main topic which users looked for advice on was discipline, dismissal and grievance (30%), followed by contracts and working arrangements (18%) and absence, sickness, health and well-being (12%). Less common main topics were holidays, working time and rest breaks (7%), family friendly and parental rights (4%), pay (4%) and information relating to COVID-19 (1%) and managing staff (1%). Compared to 2018, more users in 2021 named discipline, dismissal and grievance as the main topic they looked for advice on (30% vs 23%).
Note: Information relating to COVID-19 was not a prompted option. This is captured explicitly in a later question, therefore its prevalence is higher than initially seems here.
Figure 4.2 below breaks the top 5 topics down in more detail, along with the other topics they looked for advice on.
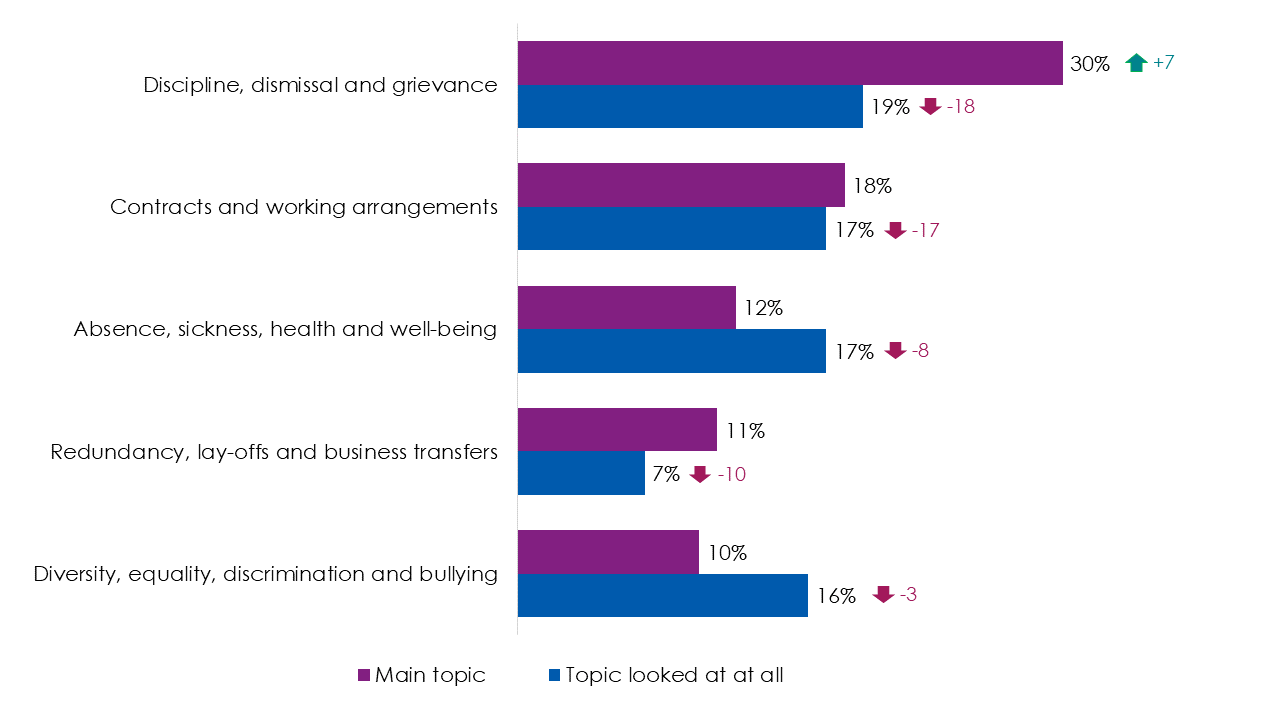
Employee-side users were more likely to have selected discipline, dismissal and grievance as the main topic (32%) or a topic looked at at all (23%), compared with employer-side users (26% and 14% respectively). Further differences between types of user also exist: as well as discipline, dismissal and grievance, employee-side users were also more likely than employer-side users to have given the main topic as diversity, equality, discrimination and bullying (13% vs 6%). In contrast, employer-side users were more likely to have looked mainly for advice on family friendly and parental rights (8% vs 2%).
There were some main topic differences with regard to the gender of users. Female users were more likely than male users to have looked mainly for advice on family friendly and parental rights (6% vs 2%) or absence, sickness, health and well-being (13% vs 8%).
There were also significant differences between the devices users were using with respect to the main topic that users were looking for advice on. Users visiting the advice pages on a computer were more likely than those using a mobile or tablet to have mainly been looking for advice on contracts and working arrangements (20% vs 13%), redundancy, lay-offs and business transfers (12% vs 7%) or family friendly and parental rights (5% vs 1%). In contrast, those using a mobile or tablet were more likely to have mainly been looking for advice on absence, sickness, health and well-being (17% vs 10%) or diversity, equality, discrimination and bullying (15% vs 9%).
COVID-19-related queries
In light of the ongoing COVID-19 pandemic, and the serious economic and societal impacts this has had, the 2021 survey also asked users if their query was about an issue related to COVID-19. While three quarters (75%) of all users said their query was not related to COVID-19, 1 in 10 (11%) said it was related to COVID-19 to a large extent, and more than 1 in 10 (13%) outlined it was to some extent.
Those users whose query they sought advice about did relate to COVID-19 gave a number of reasons for why this was the case. Changes in terms and conditions of employment and mental health and wellbeing were the most cited of these COVID-19-related issues (39% respectively), followed by changes in working arrangements (36%). The full breakdown of these COVID-19-related issues is shown in Figure 4.3.
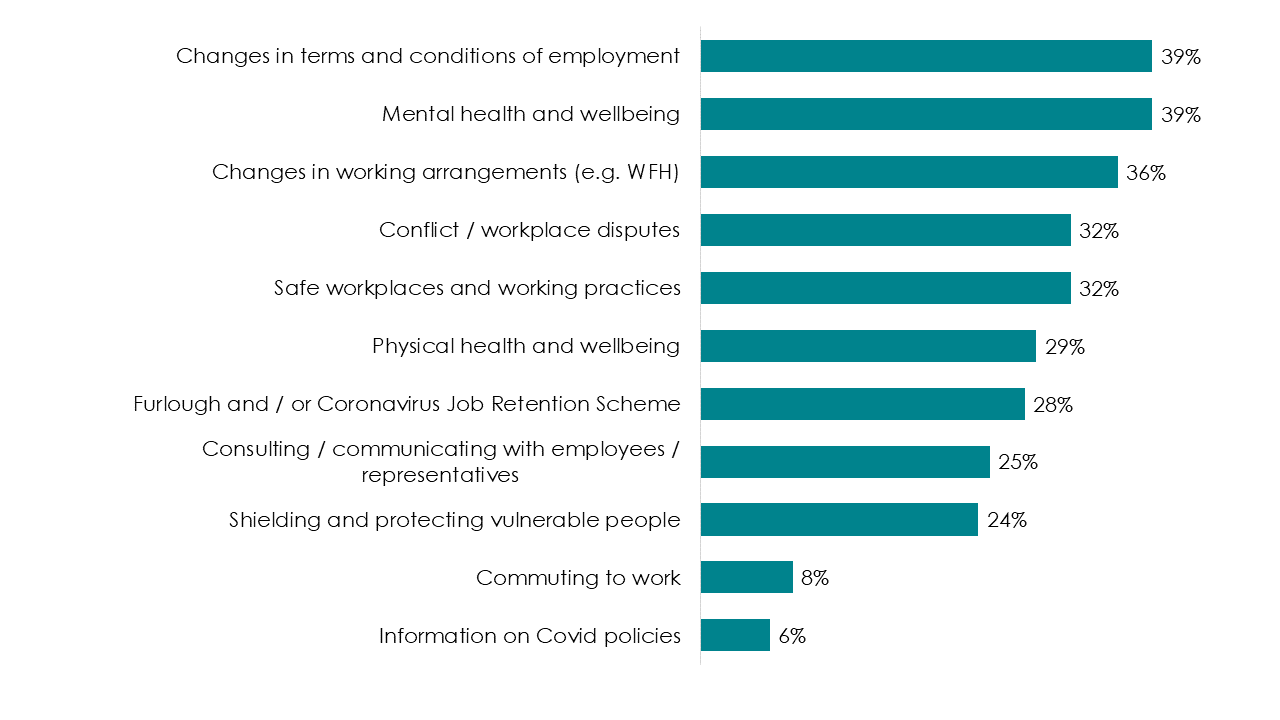
Employee-side users whose query related to COVID-19 were more likely than employer-side users to have a query about mental health and wellbeing (45% vs 28%), conflict or workplace disputes (42% vs 17%), or physical health and wellbeing (36% vs 19%).
Those who used Acas advice because they wanted information about a particular topic area more generally were more likely to say their COVID-19-related query concerned safe workplaces and working practices (42%) or consulting or communicating with employees or employee representatives (34%) than those using advice around a specific workplace query (29% and 22% respectively).
Regarding gender difference, female users were more likely than male users to have a COVID-19 query regarding changes in working arrangements (42% vs 27%). Conversely, male users were more likely to have a query about conflict or workplace disputes than female users (42% and 28% respectively).
Purpose that Acas digital advice was being used for
Respondents were asked to say what specifically they were using the advice for. Responses are detailed in Figure 4.4 below.
The main answer given as to why users were using Acas advice was 'to help solve a problem at work' (70%), followed by users seeking reassurance that they 'had taken the right course of action’ (57%). There were some differences in the responses of all users vs 2018. 2021 users were more likely than in 2018 to have used Acas advice to help solve a problem at work (70% vs 59%), to reassure them they had taken the right course of action (57% vs 43%), for general information (40% vs 31%), and to answer queries from senior management (17% vs 11%).
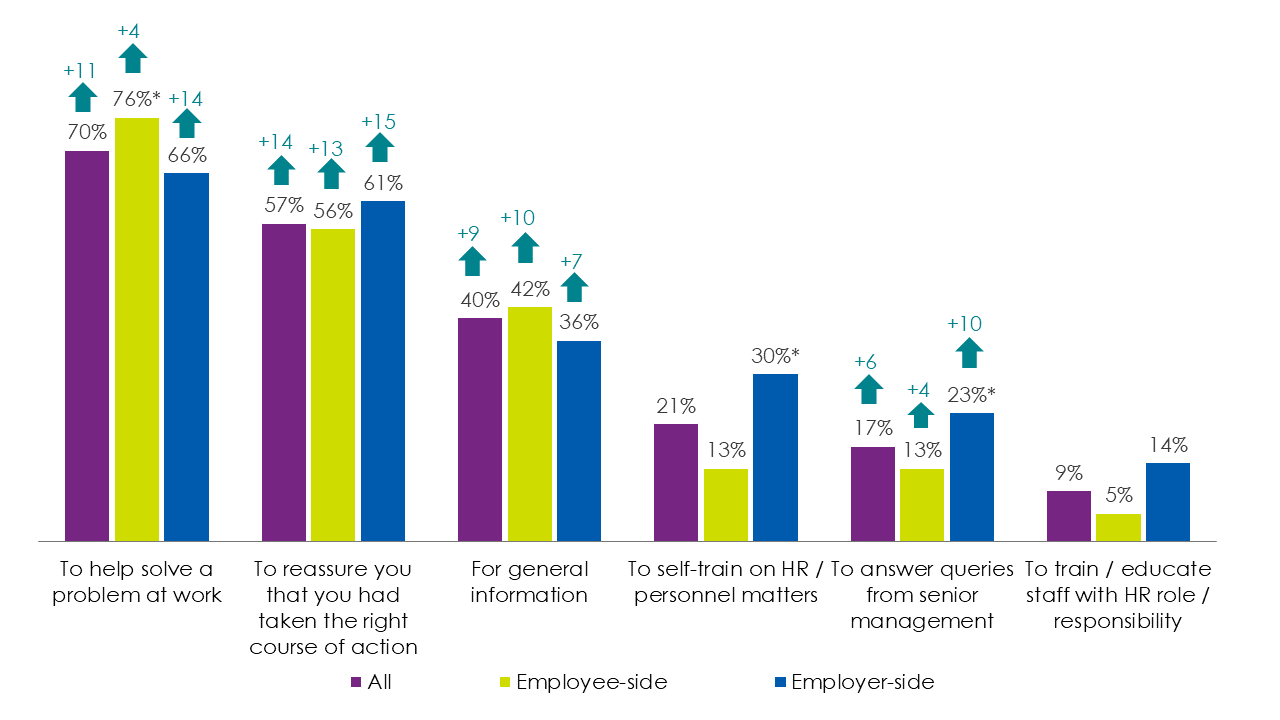
Employee-side users were more likely than employer-side users to have looked at the advice pages in order to help solve a problem at work (76% vs 66% of employer-side users). Conversely, employer-side users were more likely than employee-side users to have looked at the advice pages to self-train on HR or personnel matters (30% vs 13%) or to answer queries from senior management (23% vs 13%).
There were some differences in the usage of Acas advice by gender. Female users were more likely than male users to have used advice to self-train on HR or personnel matters (23% vs 17%), while male users were more likely to have used advice for general information (45% vs 37%).
There were also some differences in advice usage by age. Users aged 18-34 (31%) or 35-54 (25%) were more likely to have used advice to self-train on HR or personnel matters than those aged 55+ (18%). Similarly, users aged 18-34 or 35-54 (44% respectively) were more likely to have used advice for general information than those 55+ (37%).
5. User journey
This chapter covers the user journey, including their previous use of the Acas website. It summarises what users did before reaching the advice pages, how they reached them and what device they accessed them on. It also explores other sources, both Acas and elsewhere, that were used and why others were used.
Key findings
- Fewer users went straight to the Acas advice pages in 2021 than in 2018, and more users visited GOV.UK beforehand.
- The type of device used to access advice differed, with more users looking at the advice on their personal computers or mobile phones.
- In terms of the use of the Acas helpline, more users called the Acas helpline at some point in their journey when compared with 2018, though fewer looked only after looking at the advice.
Previous use of the Acas website
Three-quarters of users (75%) confirmed having used the Acas website before; this was more likely to be the case amongst employer-side users than employee-side users (93% vs 61%). This may be a reflection of employers being more commonly exposed to situations that necessitate employment relations advice, given the one-to-many nature of the employment relationship.
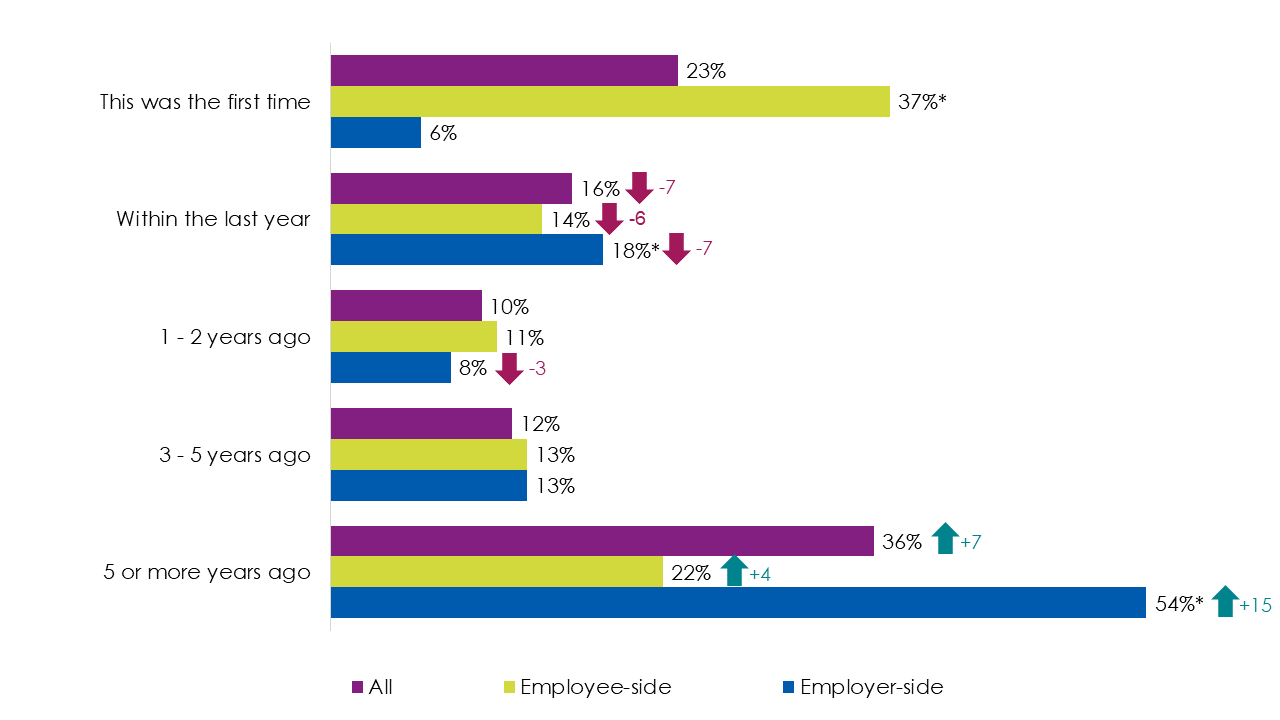
Employer-side users also had a more historic relationship with the Acas website, with 54% having visited the website for the first time over 5 years ago. However, only slightly more than a fifth (22%) of employee-side users first visited the website that long ago. Compared with 2018, more users in 2021 had visited the Acas website for the first time 5 or more years ago (36% in 2021 vs 29% in 2018).
A full breakdown of when users first visited the Acas website is detailed in Figure 5.1.
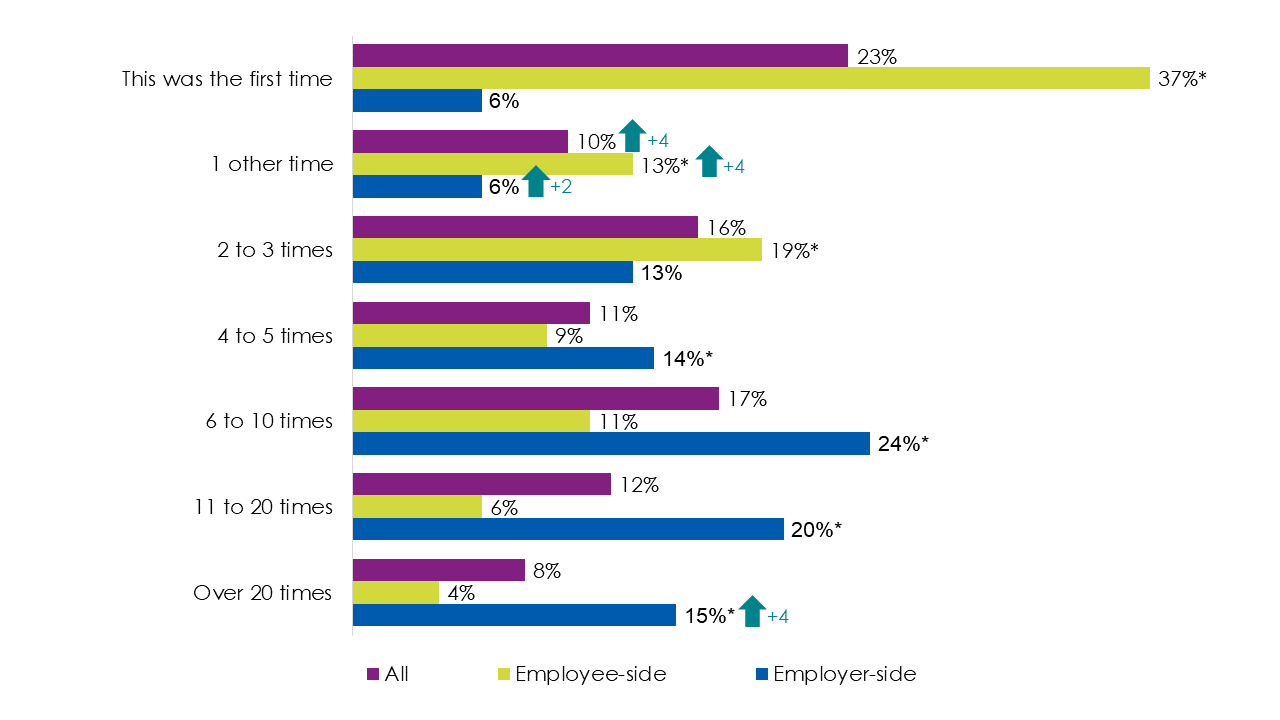
Similar patterns were present in terms of the number of times users reported having visited the website in the past 12 months, with employer-side users generally visiting the website more times in this time period than employee-side users. Indeed, more than one in 10 (15%) employer-side users had visited the website over 20 times in the past 12 months (compared with 8% of employee-side users). Further breakdown of these significant differences can be seen in Figure 5.2.
Certain users were more likely to be frequent or repeat users of Acas digital advice than others. This included users searching for information on topics like holidays, working time and rest breaks (11% had used the website over 20 times in the past 12 months) and contracts and working arrangements (10% between over 20 times).
Use of external sources of information prior to reaching Acas advice
While most Acas digital advice users used another source of advice before they reached the Acas advice pages, just under 2 in 5 (37%) went straight to the Acas advice pages. However, compared with 2018, fewer users went straight to the Acas advice pages in 2021 (42% in 2018 vs 37% in 2021).
Employer-side users were more likely than employee-side users to have gone directly to the Acas advice pages (40% vs 34%). The other most common route to Acas advice was via GOV.UK (visited by 35% of all users before reaching Acas), with more users going via this route than in 2018 (28%). Further breakdown of these differences can be seen in Figure 5.3.
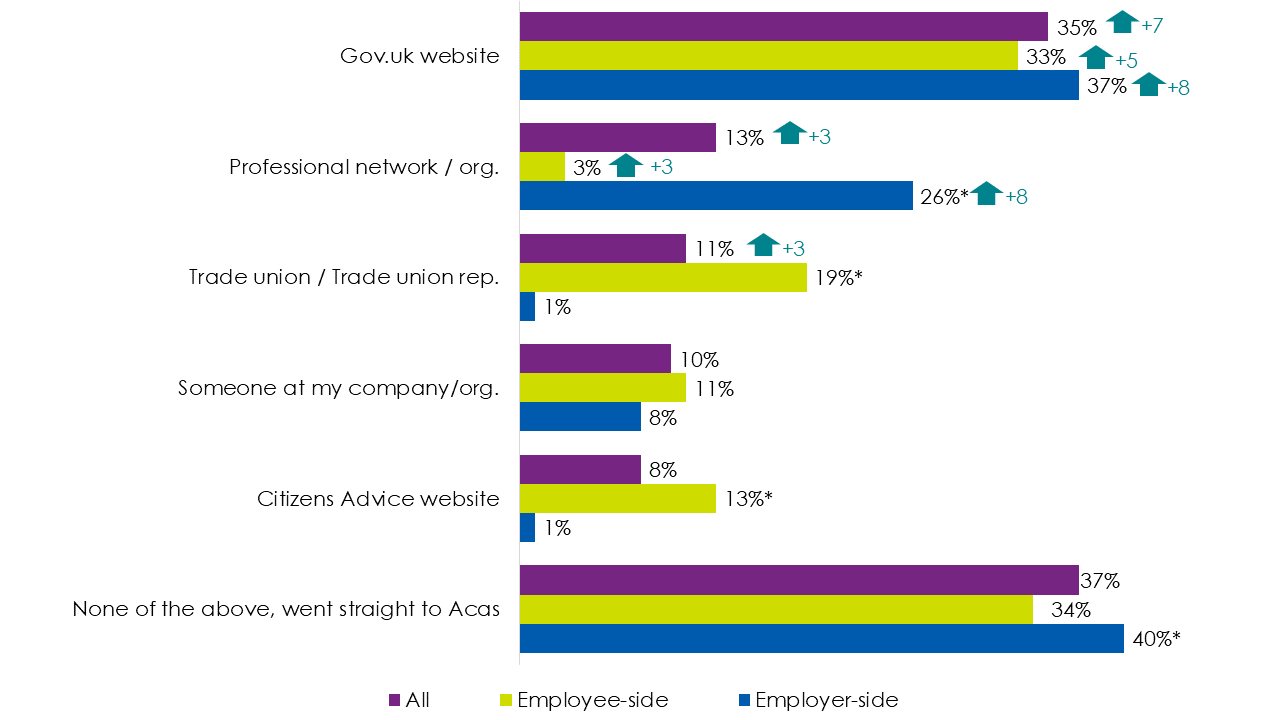
Other sources used before reaching Acas digital advice mentioned by fewer users included a lawyer or solicitor (8%), other government department website (8%) and online HR resource (7%).
Employer-side users were also more likely to first look for information from a professional network or organisation (26% vs 3% of employee-side users) or online HR resource (17% compared to 0% of employee-side users). In contrast, employee-side users were more likely to get to Acas advice via a trade union or trade union representative (19% vs 1% of employer-side users), the Citizens Advice website (13% vs 1% of employer-side users), or a lawyer or solicitor (9% vs 6% of employer-side users).
More than 2 in 5 of all the users arrived at the Acas advice pages from another Acas source (45%). This included being directed to the advice by another page on the Acas website, an Acas email newsletter, or a member of Acas staff. Compared to 2018, fewer users reached the advice pages by clicking through to it from an Acas newsletter (3% in 2021 vs 10% in 2018), with this caused by a substantial fall in employer-side users accessing the advice pages this way (2% in 2021 vs 17% in 2018).
2 in 5 users (39%) reached the advice pages by searching for a topic on a search engine, such as Google. This is a significant increase compared with 2018 (31% arrived at advice pages via a search engine). Responses are detailed in Figure 5.4 below.
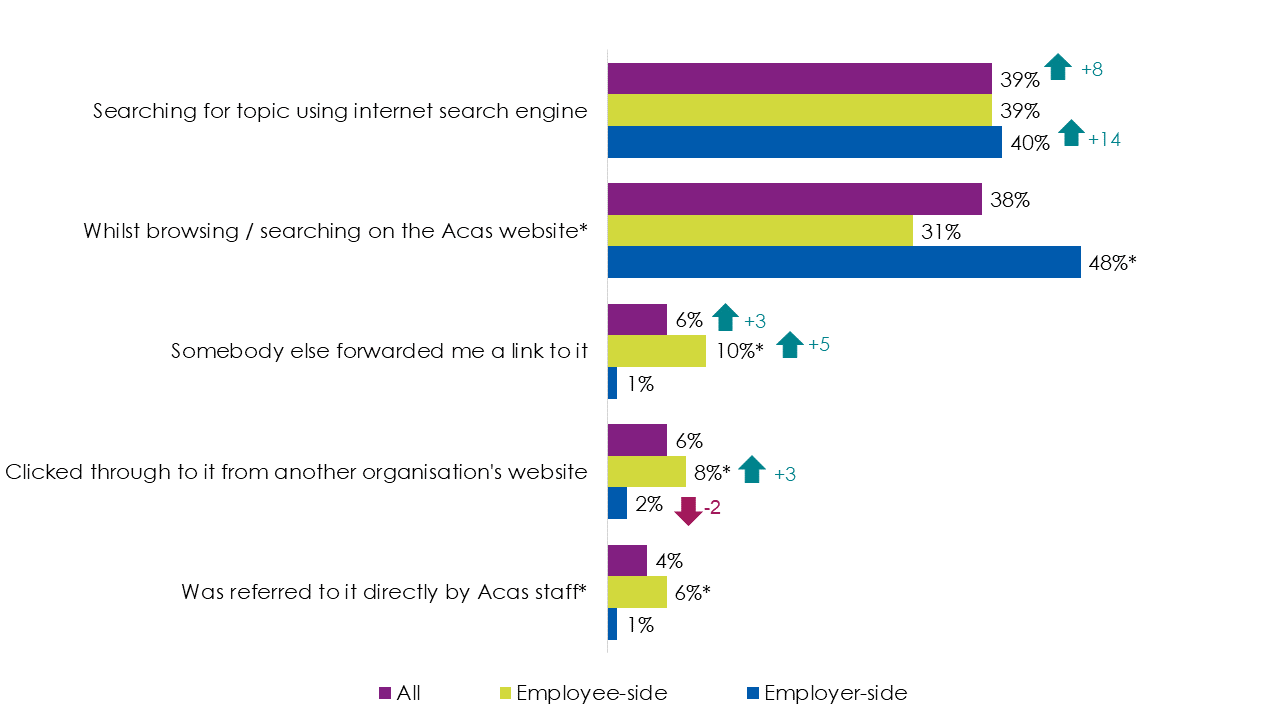
Employer-side users were more likely than employee-side users to have arrived at the advice pages through browsing or searching the Acas web-site (48% vs 31%) or via bookmarks (3% vs 1%). Conversely, employee-side users were more likely to have reached the advice pages through some non-Acas routes, with the exception of direct referrals by Acas staff (6% and 1% respectively). Employee-side users were more likely to have been directed to the advice pages by somebody else forwarding them a link (10% vs 1%) or clicking through from another website (8% vs 2%).
Users accessing the advice through a computer were more likely than those on a mobile or tablet to reach Acas advice pages whilst browsing or searching on the Acas website (41% vs 28% respectively). In contrast, those on a mobile or tablet were more likely than computer users to have been forwarded a link by somebody else (10% vs 5%) or to have been referred to it directly by Acas staff (10% vs 2%).
As was the case in 2018, those who had used the Acas website before were more likely to have arrived at the Acas advice pages from an Acas source (51%) than first-time users (24%). Just under half (45%) of repeat users reached the advice pages whilst browsing or searching on the Acas website, compared with fewer than 2 in 5 (16%) of those that had not visited the website before.
Devices used to access Acas digital advice
The majority of users accessed the Acas advice pages through a work or personal computer (77%). Just under 2 in 5 (17%) accessed the pages using a mobile phone and 6% accessed the pages with a tablet. Compared with 2018, fewer users used their work computers (44% in 2021 vs 52% in 2018), and more used a personal computer (33% vs 29%) or mobile (17% vs 11%). The significant increase in personal computer usage is likely to be due to increased homeworking as a result of the COVID-19 pandemic. Responses are detailed in Figure 5.5 below.
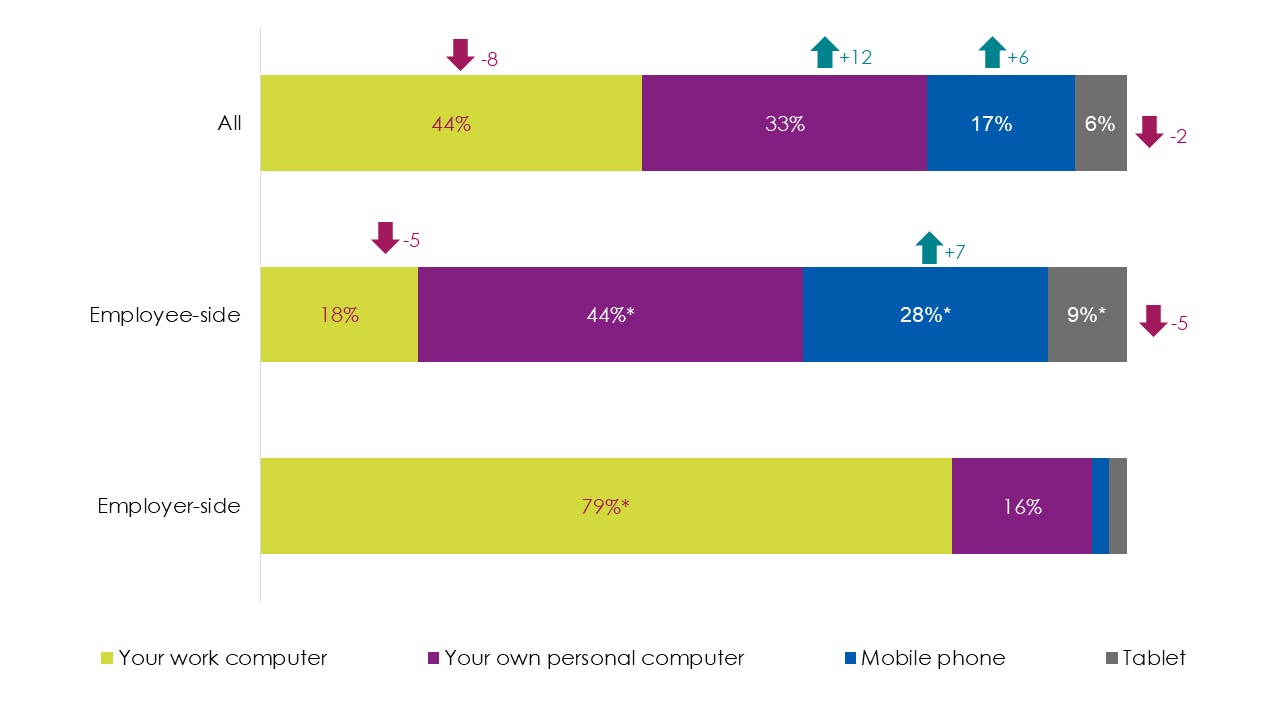
Perhaps unsurprisingly, employer-side users were more likely than employee-side users to have accessed the advice pages through a work computer (79% vs 18%). In contrast, employee-side users were more likely than employer-side users to access advice via their own personal computer (44% vs 16%), mobile phone (28% vs 2%), and tablet (9% vs 2%).
There was a relationship between age and the type of device used to view Acas digital advice. Users over the age of 35 were more likely than users aged 34 or younger to have viewed the website on a computer (77% vs 60%), whereas users aged 34 or younger were more likely than those aged 35 or older to have used a mobile or tablet (38% vs 22%).
Those users who had used Acas digital advice before were more likely than first-time users to have viewed the website on a computer (83% vs 42%), while first-time users were more likely than those who had used Acas advice pages before to have utilised a mobile or tablet (42% vs 16%).
Users accessing digital advice on managing staff (86%) and family friendly and parent rights (80%) were most likely to access this information through a work computer. However, those who were seeking information on discipline, dismissal and grievance, redundancy, lay-offs and business transfers, or information for trade unions were most likely to be using a personal computer (40% respectively).
How appropriate the length of Acas advice was and how it was used
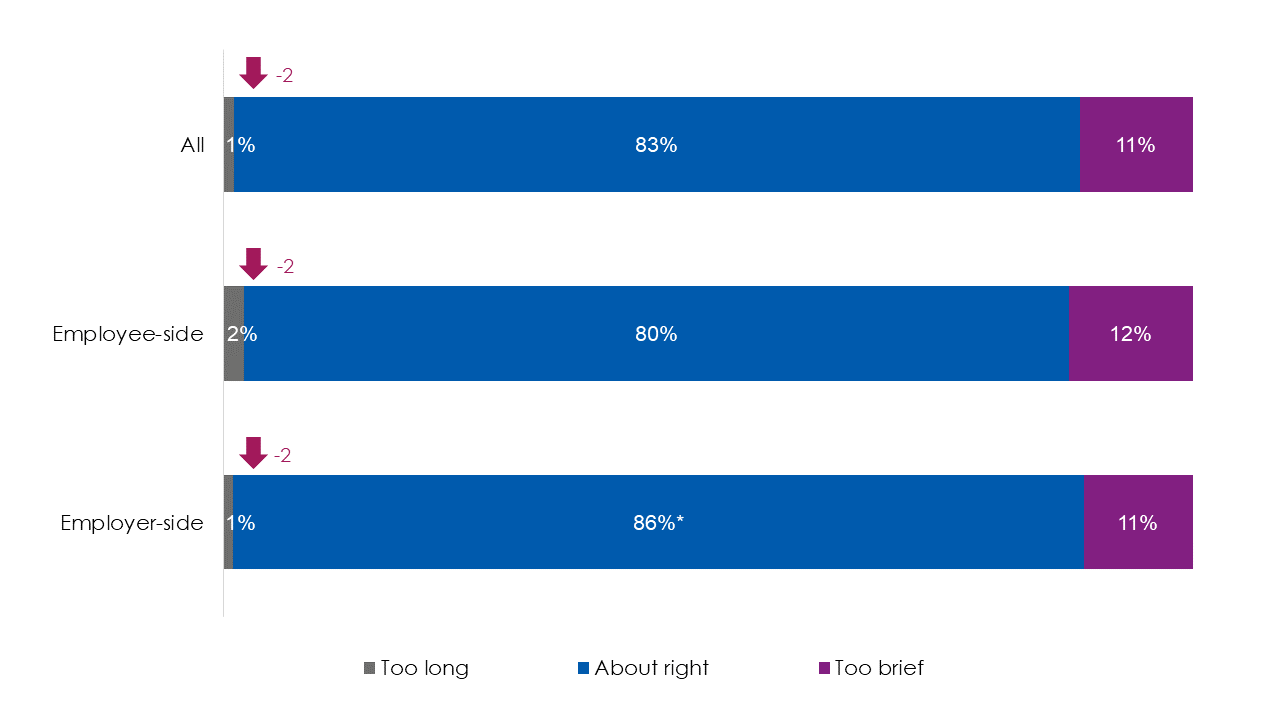
More than 4 in 5 (83%) users found the length of the Acas digital advice they read to be about right. If users felt that the advice was of an inappropriate length, it was more common for them to say that it was too brief (11%) than too long (1%). Compared to 2018 fewer users in 2021 felt the advice was too long (3%).
Employer-side users were more likely to have described the length as being appropriate (83%) than employee-side users (80%). The full breakdown is show below in Figure 5.6.
Users who said the advice did not help them solve their problem at work were less likely than those who said the advice did solve their problem, at least to some extent, to think the advice length was about right (49% vs 87%). Those whose problem was not solved were also more likely to say the advice length was too long (4%) or too brief (27%) than users whose problem was to an extent solved (1% and 10% respectively).
Users who were generally dissatisfied with the advice were more likely than those who were satisfied to say that it was too brief (42% vs 9%). In line with this, these dissatisfied users were less likely than satisfied users to say the advice length was about right (26% vs 88%).
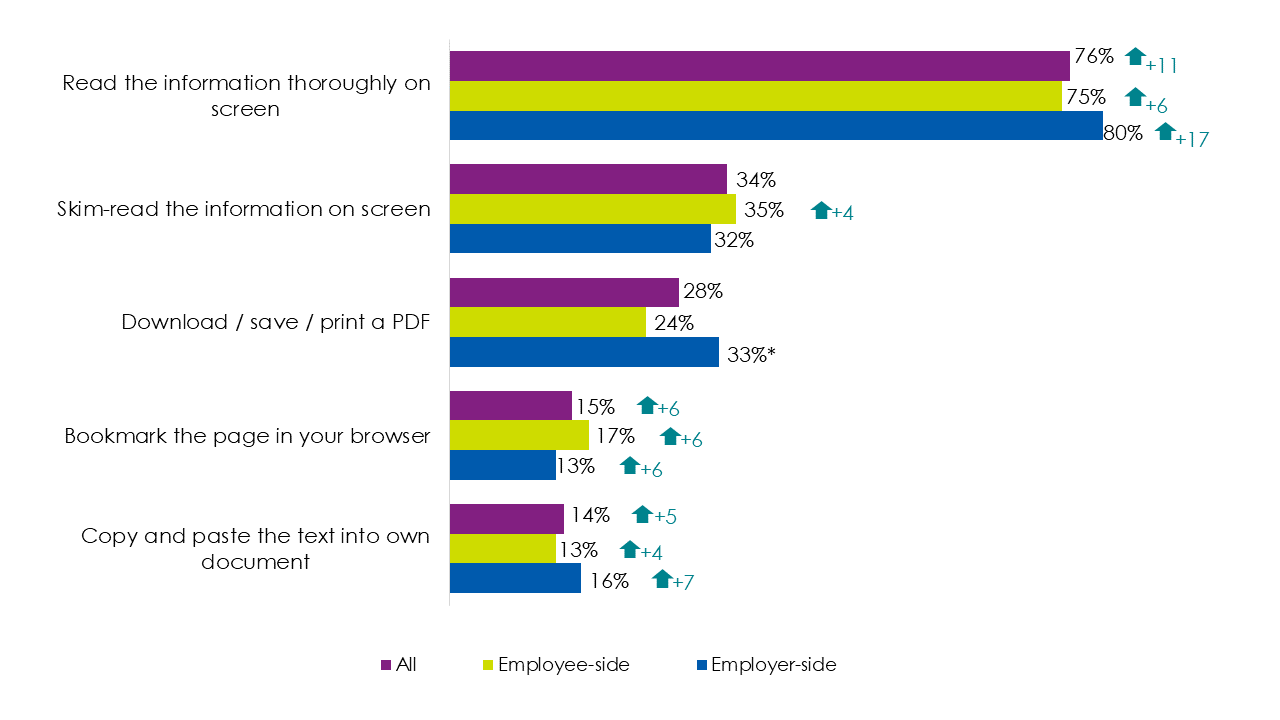
As shown in Figure 5.7 below, users reported having engaged with Acas digital advice in a number of different ways. The majority of users confirmed having viewed the digital advice 'on-screen' rather than offline; 76% of users read the information thoroughly on screen and 34% of users described themselves as having skim-read the information on screen. Over a quarter (28%) of users downloaded, saved, or printed a PDF. Less common was for users to have bookmarked the page in a browser (15%), copied and pasted the text into a document (14%), printed the information directly from the webpage (13%), emailed the page (10%), or shared the page on social media (2%).
Compared with 2018, the proportion of users engaging in each of these ways of using the advice has increased, although fewer printed the information directly from the webpage in 2021 (13% in 2021 vs 16% in 2018).
There were some significant differences between employee-side and employer-side users in the way that each group viewed Acas advice pages in 2021. Employee-side users were more likely than employer-side ones to have emailed the page (12% vs 8%) and shared it on social media (3% vs 1%). In contrast, employer-side users were more likely than employee-side counterparts to have downloaded, saved or printed a PDF (33% vs 24%), perhaps signalling their intention to treat it as a longer-term resource.
Note: Where the chart shows a significant increase, these individually increased for both employee-side and employer-side users.
Users who accessed the advice pages via a computer were more likely than those using a mobile or tablet to have: read the information thoroughly on screen (78% vs 72%); downloaded, saved or printed a PDF (30% vs 22%); copied and pasted the text into their own document (16% vs 7%); or printed the information directly from the webpage (15% vs 7%).
Users who visited the website for advice relating to family friendly and parental rights were more likely than others to have read the information thoroughly on screen (88%). Meanwhile, users looking for information relating to diversity, equality, discrimination and bullying were more likely to have emailed the page than others (16%).
When it comes to the number of 'sittings' users referred to Acas advice in, more than half (54%) of all users viewed the information in one sitting rather than across multiple sittings (44%). The proportion referring to the advice in one sitting was lower in 2021 than in 2018 (54% in 2021 vs 59% in 2018), while the proportion referring to it in more than one sitting was higher in 2021 than in 2018 (44% in 2021 vs 39% in 2018).
Just under half of users spent 10 to 30 minutes reading the advice (48%), with 79% of users spending 10 minutes or longer on the Acas website in total (19% spent between 30 minutes and an hour on the website, and 12% of users spent over an hour). Compared with 2018, users were more likely in 2021 to spend more than an hour reading the advice (9% in 2018 vs 12% in 2021) and less likely to spend 10-30 minutes reading it (52% in 2018 vs 48% in 2021).
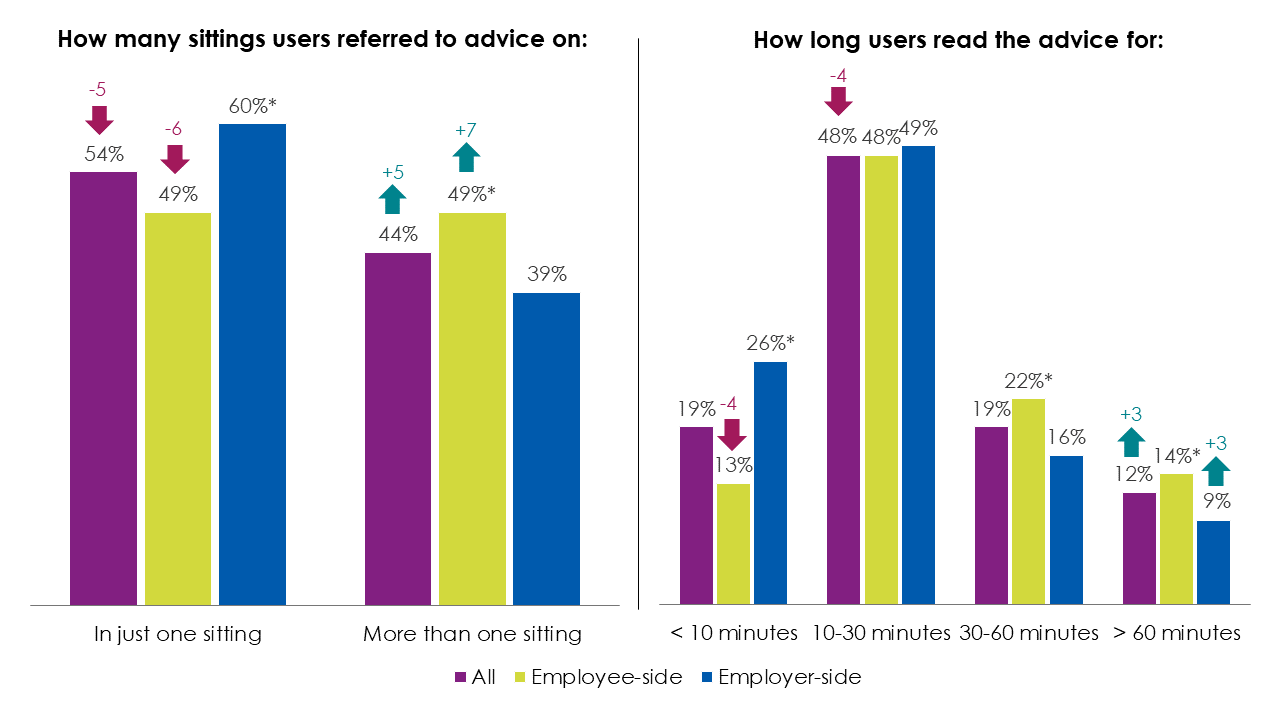
As displayed in Figure 5.8 above, employer-side users tended to consume advice for shorter time periods and split across fewer sittings than their employee-side counterparts. As in 2018, the former were more likely to have consulted Acas advice in just one sitting (60%) than employee-side users (49%), with employee-side users being more likely to have consulted the advice across multiple sittings (49%) than employer-side users (39%). Employer-side users were also more likely to have spent less than 10 minutes consulting the advice (26%) than employee-side users (13%). Conversely, employee-side users were more likely to have spent 30 minutes to an hour (22%) or over an hour (14%) than employer-side users (16% and 9% respectively).
Users who were looking for advice regarding family friendly and parental rights (32%) were most likely to read the advice for less than 10 minutes. In terms of the number of sittings advice was consumed during, users looking for advice on diversity, equality, discrimination and bullying, and discipline, dismissal and grievance, were the most likely to refer to the advice in more than one sitting (53 and 50% respectively).
Users who had used the Acas advice pages before were more likely than first-time users to have spent less than 10 minutes reading the advice (21% vs 15%), while first-time users were more likely than those who had used Acas advice pages before to have read the advice for over an hour (16% vs 11%).
Users who viewed the advice on a computer were more likely (56%) to have done so in just one sitting than users who viewed the advice on a mobile or tablet (47%). This is likely due to most mobile phone and tablet users being employee-side users compared with most computer users being employer-side users.
Similarly, computer users were more likely than mobile or tablet users to have spent less than 10 minutes reading the advice (21% vs 14%), while mobile or tablet users were more likely than those using a computer to have read the advice for over an hour (17% vs 10%).
Other Acas tools used in combination with its digital advice
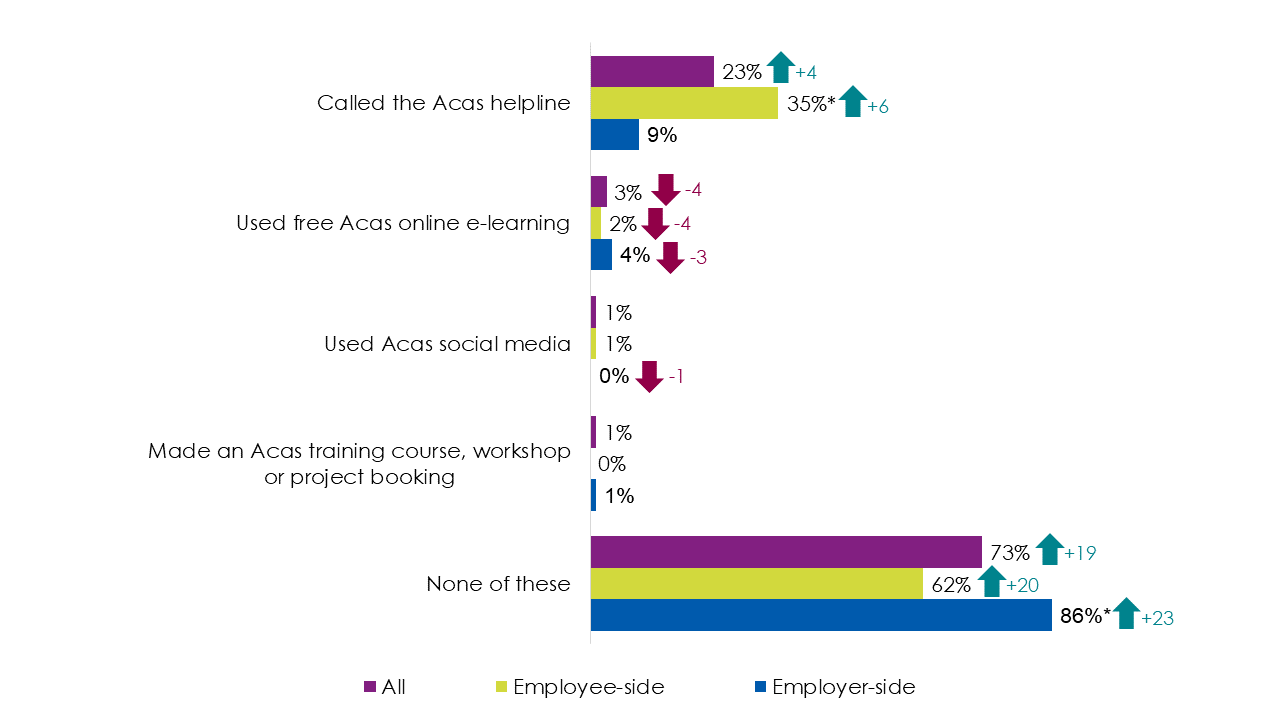
As shown in Figure 5.9, Acas provides advice in several ways other than via the Acas advice pages. The Acas telephone helpline (23%) is the most used of these other tools, with few users of Acas digital advice also using free Acas online elearning (3%), Acas social media (1%), or making an Acas training course, workshop or project booking (1%). Nearly three-quarters (73%) of all users confirmed not having used any other Acas tool to help them resolve the main topic that they were searching for advice on.
2021 users were more likely than those in 2018 to have called the Acas helpline (23% vs 19%) or to have not used any other source of Acas advice (73% vs 54%). Conversely, users in 2018 were more likely to have used online e-learning (7% vs 4%).
Employee-side users were more likely than employer-side users in 2021 to use other forms of advice from Acas, with more than a third of employee-side users calling the Acas helpline (35% vs 9%). In contrast, employer-side users were more likely than employee-side ones to have not used other forms of Acas advice (86% vs 62%).
Users with a specific workplace query were more likely than those with an interest in a topic area more generally to have called the Acas helpline (27% vs 10%).
Users looking for advice on pay (39%), discipline, dismissal and grievance (29%), and diversity, equality, discrimination and bullying (28%) were the most likely to call the Acas helpline – perhaps suggesting that these subjects are particularly complicated for users, whose advice-seeking on these topics takes on multiple modes. Conversely, those interested in family friendly and parental rights were more likely than others to have not used any other forms of Acas advice (92%).
Users who used a mobile or tablet (40%) were more likely to have called the Acas helpline than those using a computer (18%). Those on a computer were more likely than mobile or tablet users to have not used any other forms of advice (77% vs 57% respectively).
Use of Acas helpline in combination with advice pages
Of the 23% of all users who called the Acas helpline, 3 in 5 (61%) called after accessing the Acas advice pages. Two in 5 (20%) called before accessing the digital advice and a similar proportion called both before and after looking (19%).
Compared with 2018, fewer users in 2021 called the Acas helpline after looking online (71% in 2018 vs 61% in 2021), although more called both before (15% vs 20%), as well as before and after (14% vs 19%).
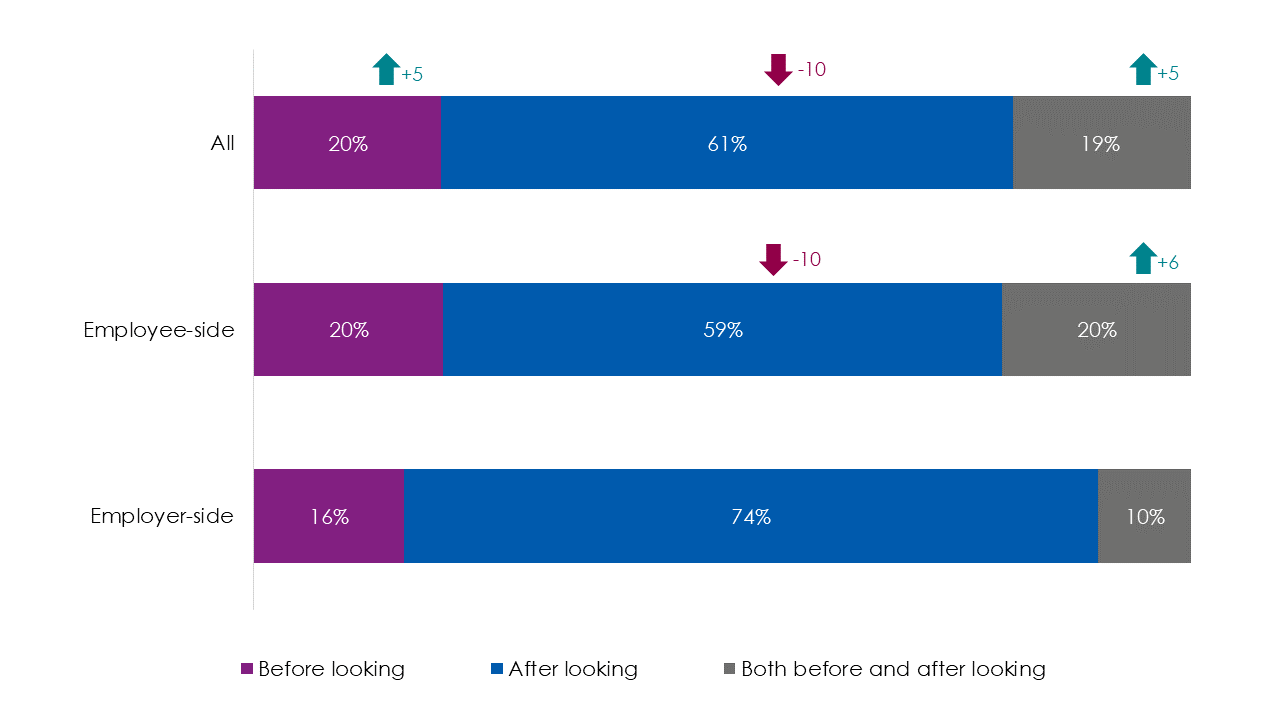
As outlined previously, employee-side users were more likely than employer-side users to call the Acas helpline (35% vs 9%). Employee-side users tended to be more inclined to call the Acas helpline before and both before and after looking at the advice pages, while employer-side users were more inclined to call after looking.
Focusing only on those who called the Acas helpline after using the advice pages, more than 3 in 5 of these users did so because they wanted to confirm the online information (63%). Other reasons for calling the Acas helpline afterwards included that users felt there was not enough detail provided in the digital advice or that it only partly answered their query (49%) and that they could not find the information or advice that they were seeking on the Acas website (40%). One in 3 (33%) users who called after looking at the digital advice said that they had always planned to call the Acas helpline anyway. A full breakdown is shown in Figure 5.11 below.
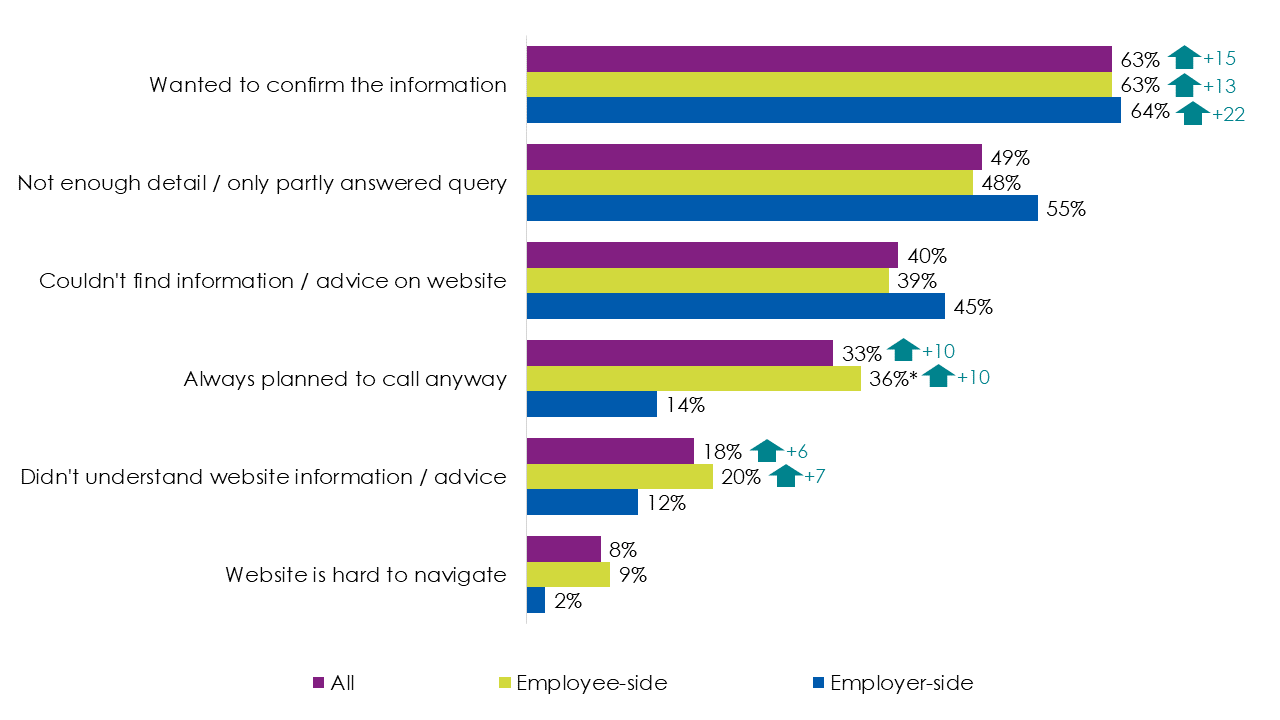
Compared to 2018, those calling after looking at the advice online were more likely in 2021 to have done so because they:
- wished to confirm the online information (63% in 2021 vs 48% in 2018)
- always planned to call (33% vs 23%), or
- they didn't understand the website information or advice (18% vs 12%)
Similar to 2018, when looking at the data broken down by user type in 2021, employee-side users were more likely than employer-side users to have called because they always planned to call (36% vs 14%).
6. Evaluation of experience
This chapter covers user experience of the advice pages including the ease of accessing the advice and satisfaction with it. It also highlights areas such as perceived trustworthiness of advice and how helpful it was in addressing their query. Whether there was any advice on a topic missing and what this was is also touched upon in this chapter. More specifically, where users were using the advice to solve a problem at work or reassure them of a particular course of action, whether the advice did so and to what extent is also assessed.
Key findings
- The majority of users were satisfied with their experience and found the advice easy to access. Both findings were consistent with 2018.
- In addition, most users were positive regarding the helpfulness of the advice, with several improvements since 2018.
- For almost all measures, employer-side users were more positive about the advice pages than employee-side users.
- Repeat users of the advice pages were more positive across the board than first-time users.
- Users who had a query related to COVID-19 were more likely to report that there was a topic missing from the website that they expected to see. They were also less likely to feel that the advice gave them the confidence to deal with similar issues in the future, covered the topics they were seeking advice on in sufficient detail, and addressed their enquiry in full, than those whose query was not related to COVID-19.
- The majority of users felt the advice was about right in length, with a decrease since 2018 in the proportion of users who felt the advice was too long.
Ease of accessing advice
The majority (84%) of users found the advice easy to access; more specifically, half (50%) of users found it very easy. Employer-side users were more likely to find it easy to access than employer-side users (89% vs 79%). This is consistent with 2018. This is outlined further in Figure 6.1 below.
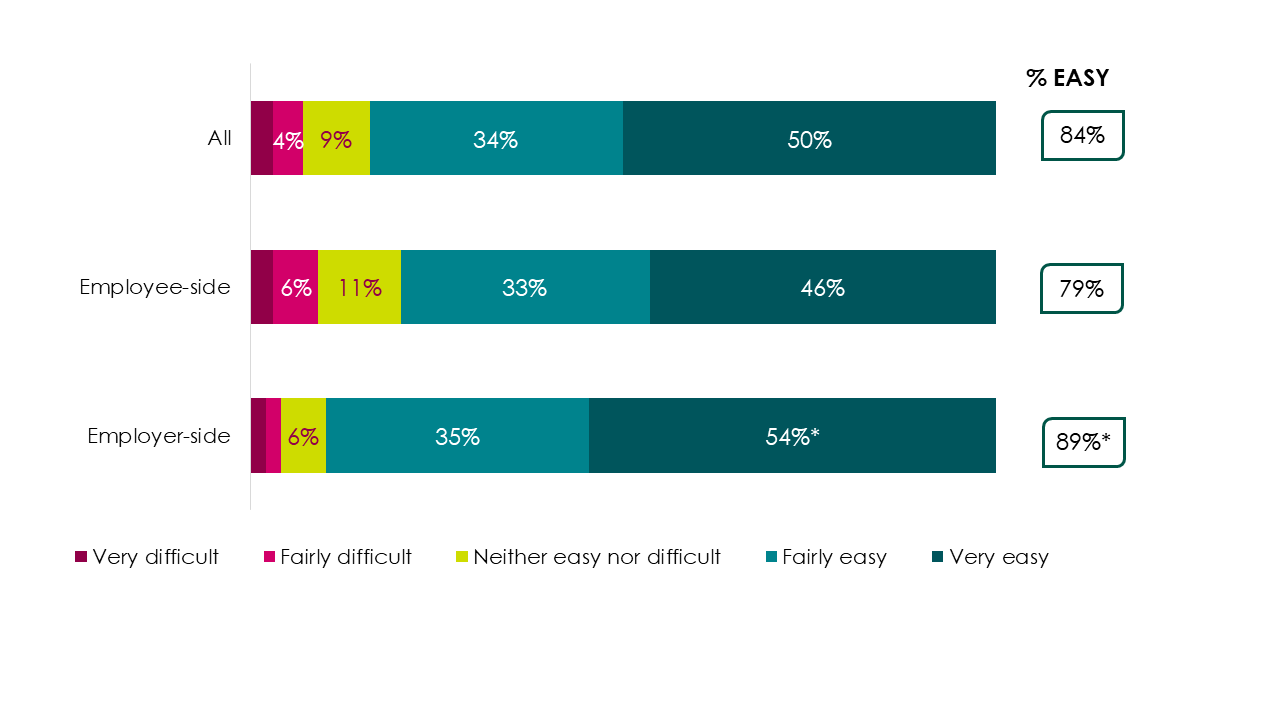
Previous users of the advice pages were more likely to find it easy to access than first-time users (86% vs 76%), though it is worth noting that these users were more likely to be employer side users who in turn found it easier to access. Users who accessed the advice using a computer were more likely to find it easy to access that those using a mobile phone or tablet (86% vs 76%).
Demographically, those without a disability were more likely to find the advice easy to access than those with a disability (87% vs 79%) and female users were more likely to find it easy than male users (85% vs 80%).
Satisfaction with advice
As shown in Figure 6.2, almost 9 in 10 (87%) users were satisfied with the advice, this is consistent with 2018 (86%). Again, employer-side users were more likely than employee-side users to be satisfied with the advice (91% vs 84%). Those who had used the Acas advice pages before were more likely to be satisfied than first time users (89% vs 83%).
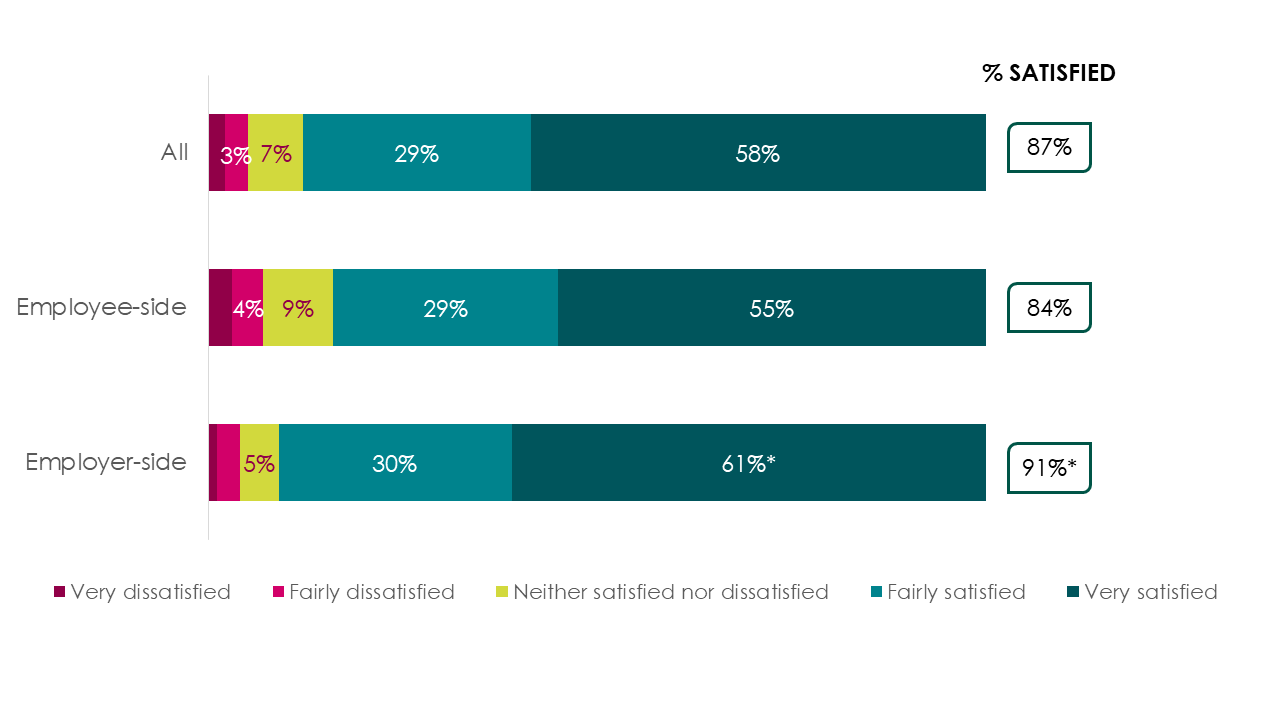
Device was linked to levels of satisfaction, with those using a computer more satisfied than those using a mobile phone or tablet (89% vs 82%). However, it is worth noting that device correlates with user type. Those using mobiles or tablets were more likely to be employee-side users, who were generally less satisfied anyway.
Perhaps unsurprisingly, where users were visiting the advice pages to solve a problem at work and it did so to at least some extent, they were more likely to be satisfied with the advice than those that felt it did not (94% vs 39%). Satisfaction also varied depending on the capacity in which they were visiting the website; users visiting the pages as a third party were more likely to be satisfied than those visiting on their own behalf (93% vs 86%).
Users who worked at a small organisation, defined as those with fewer than 50 employees, at the point of using the advice were most likely to be satisfied (91%). Users with responsibility for changing policies in the workplace were also more likely to be satisfied than those who did not have this responsibility (90% vs 85%).
Likelihood to recommend or use again
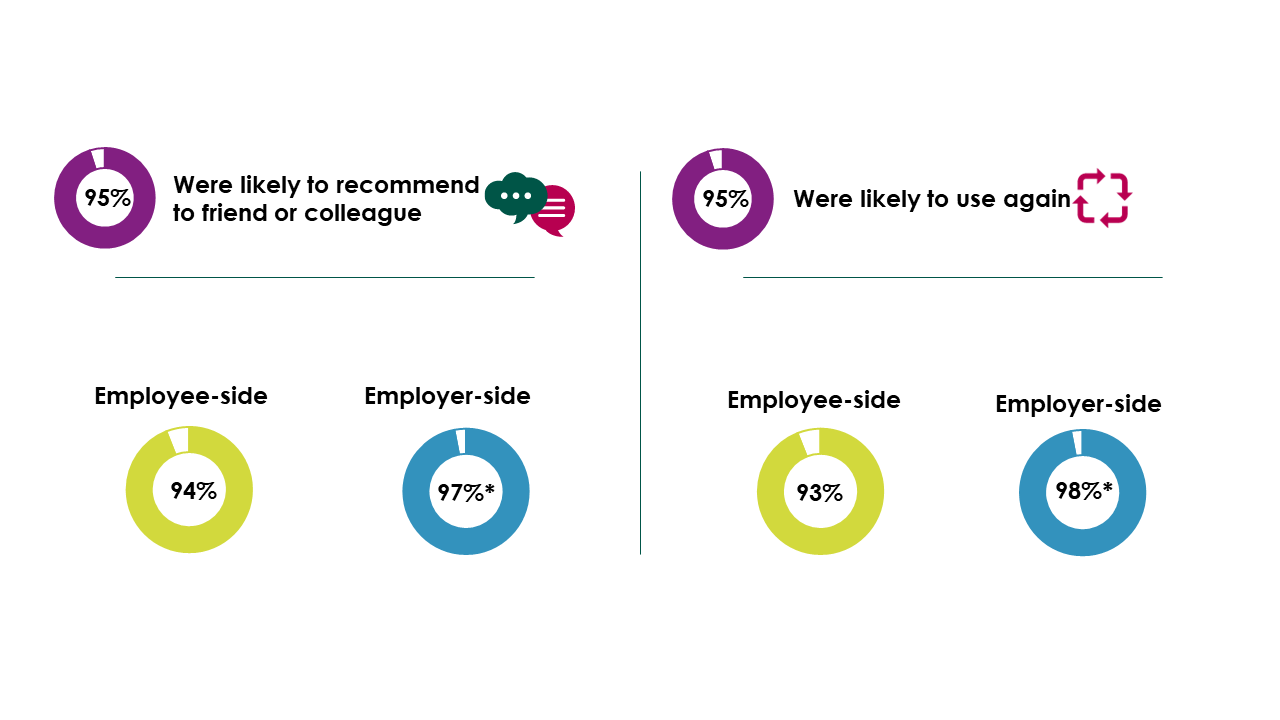
The vast majority (95%) stated that they would recommend the Acas advice to a colleague, and the same proportion would be likely to use the advice pages again. For both, measures, employer-side users were more likely than employee-side users to state this. Almost all employer-side users were likely to recommend to a colleague (97% vs 94% of employee-side) and use the advice pages again (98% vs 93% of employee-side).
Other user differences mirror those seen for satisfaction; those who accessed the advice on a computer were more likely to recommend to a friend or colleague and to use again than those using mobile phones or tablets (96% vs 92% and 97% vs 90% respectively). Users visiting on behalf of a third party were more likely to recommend the advice pages and use them again than those visiting on their own behalf (98% vs 95% and 98% vs 94% respectively).
Where the advice pages helped to solve a problem at work to at least some extent, users were more likely to recommend to a friend or colleague (99% vs 74%) and use again (98% vs 79%).
Female users were more positive on both counts; more likely to recommend to a friend or colleague (96% vs 93%) and use again (97% vs 92%). For some groups, they were more likely to state that they would use the advice again but there were no differences with regards to recommending to a friend or colleague. These included; those without a disability (97% vs 92% of those with a disability), those who had used the advice pages before (97% vs 90% who were first time users) and those with responsibility for changing policies in the workplace (98% vs 94% of those without this responsibility).
Perceptions of the advice
Users were positive about the advice pages with regards to how it was presented, how accessible it was and whether it was up-to-date and trustworthy. Over 9 in 10 users agreed that the advice pages were trustworthy (93%), easily accessible to them (93%), presented in an impartial way (92%), presented in a way they easily understood (90%) and just under 9 in 10 (86%) felt it was up-to-date. For all of these, employer-side users were more likely to agree than employee side users, as detailed in Figure 6.4.
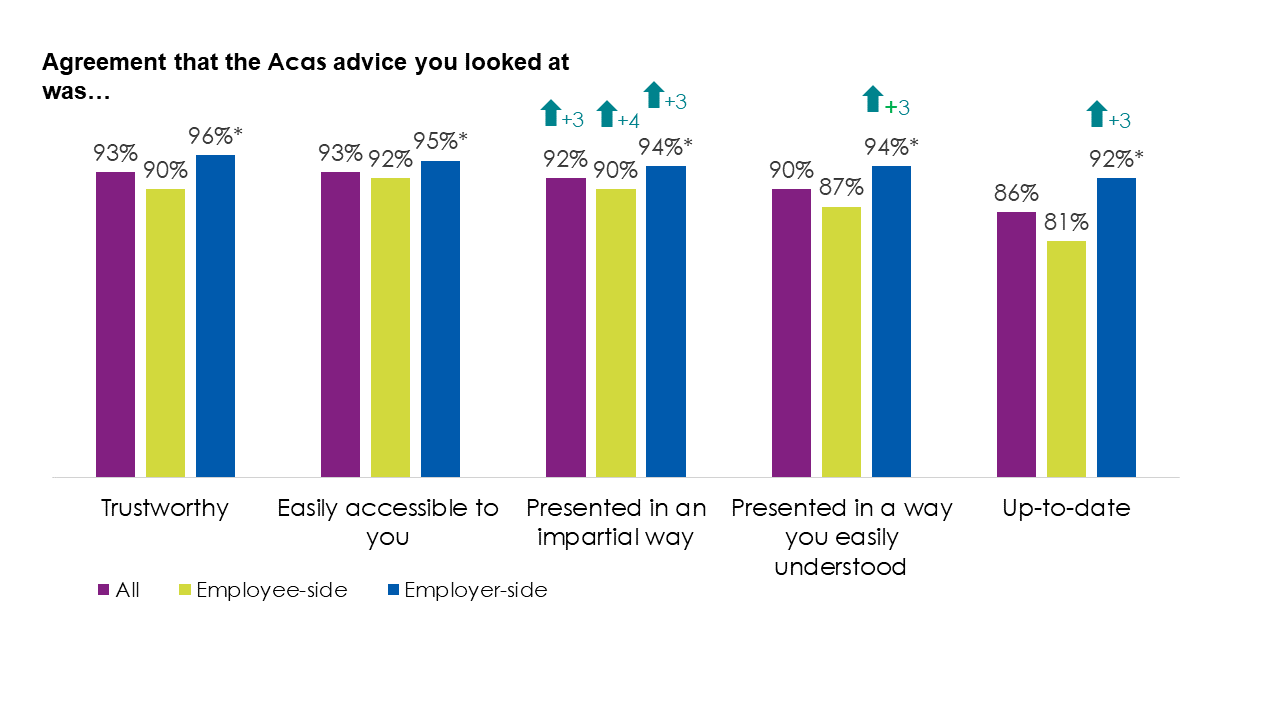
Compared with 2018, there has been a handful of positive shifts regarding perceptions of the Acas advice. Across all user types, there was an increase in those who agreed that the advice was presented in an impartial way (3 percentage points). This improvement was observed amongst both employee-side (4 percentage points) and employer-side users (3 percentage points). Amongst employer-side users specifically, there has also been an increase since 2018 in those who felt the advice was presented in a way they easily understood (3 percentage points) and that it was up-to-date (3 percentage points).
For all statements, those who used the advice to solve a problem at work and felt it did to at least some extent were more likely to agree than those who did not feel it solved their problem that the advice was:
- trustworthy (97% vs 66%)
- easily accessible to you (97% vs 75%)
- presented in a way you easily understood (96% vs 55%)
- presented in an impartial way (96% vs 68%)
- up-to-date (92% vs 57%)
The same was the case for those who passed on the information compared with those who did not pass on the information, they were more likely to agree that the advice was:
- trustworthy (97% vs 90%)
- easily accessible to you (96% vs 91%)
- presented in a way you easily understood (95% vs 87%)
- presented in an impartial way (95% vs 89%)
- up-to-date (91% vs 83%)
Those using a computer were more likely than those using a mobile phone or tablet to agree that the advice was presented in a way that they easily understood (92% vs 85%), trustworthy (94% vs 87%) and up-to-date (87% vs 82%).
Those who had used the advice pages before were more likely than first-time users to agree that the advice was easily accessible to them (95% vs 91%), presented in a way they easily understood (92% vs 87%) and trustworthy (94% vs 89%). Users who were seeking advice in a third party capacity were more positive about the presentation of the advice, as they were more likely than those looking on their own behalf to agree that it was presented in a way they easily understood (96% vs 89%) and in an impartial way (95% vs 91%).
Where users had responsibility for changing policies, they were more likely to find the advice easily accessible (95% vs 92%), presented in a way they easily understood (94% vs 88%), trustworthy (95% vs 91%) and up-to-date (91% vs 83%) than those who did not have this responsibility.
For users with a disability, they were less positive regarding the advice; they were less likely to feel that the advice was presented in a way they easily understood (87% vs 93%), presented in an impartial way (89%vs 93%), trustworthy (89% vs 95%) and up-to-date (81% vs 89%) than those who did not have a disability.
Female users were also more positive, with them being more likely to agree that the advice was easily accessible to them (95% vs 91% of male users). In addition, white users were more likely to agree that the advice was presented in an impartial way.
Helpfulness of advice
In terms of how helpful the Acas advice was in meeting user needs and answering their query, users were generally positive. Around 9 in 10 users agreed the advice was valuable to them (88%), and around three-quarters felt that the advice helped them decide what to do next (78%), gave them the confidence to deal with similar issues in the future (76%), covered the topics they were seeking advice on in sufficient detail (75%) and addressed their enquiry in full (74%). For all of these statements, employer-side users were more likely to agree than employee-side users.
However, contrastingly, when asked the extent to which they agreed that the advice was their main source of information for that employment related issue, employee-side users were more likely to agree than employer-side users. This is detailed further in Figure 6.5.
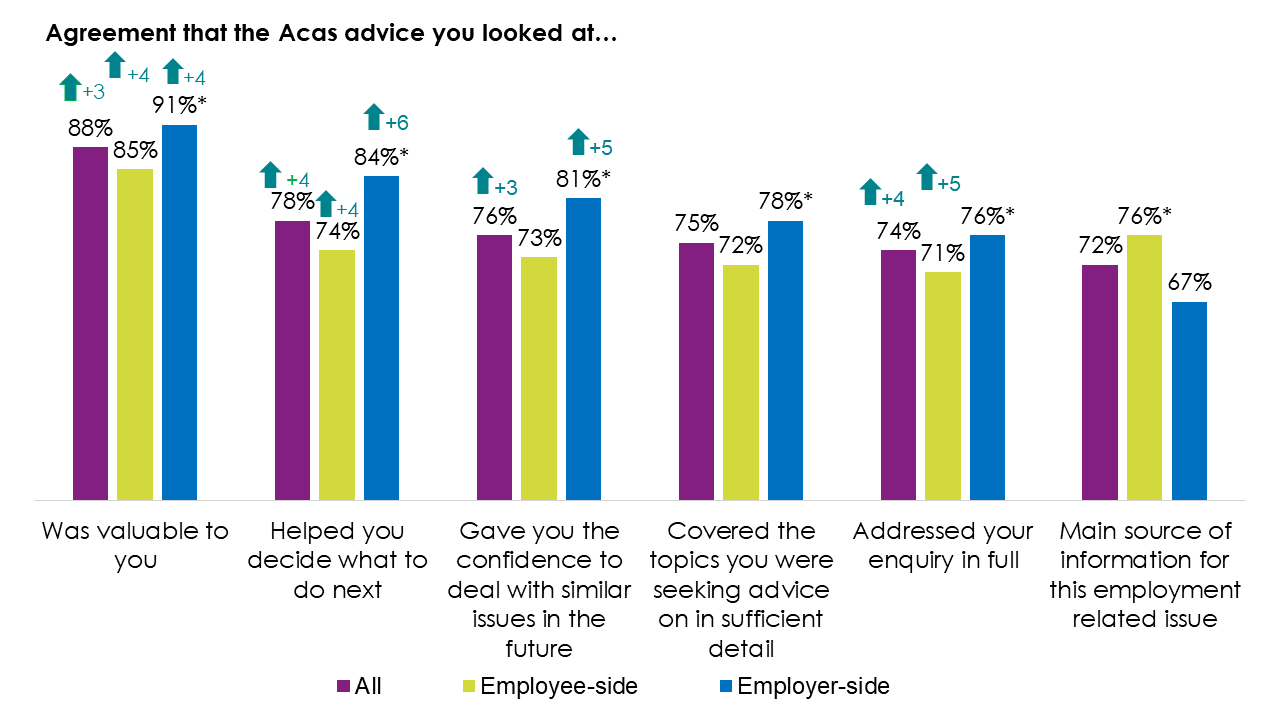
In 2021, there was an improvement across a number of measures of helpfulness of advice when compared with 2018. As shown by the arrows in Figure 6.5, there was an increase for all users and both employer and employee-side users with regards to how valuable the advice was and that it helped them decide what to do next. In addition, there was an increase amongst all users in the proportion who agreed that it gave them confidence to deal with similar issues in the future. This positive shift regarding confidence to deal with similar issues in the future was driven by the employer-side users. However, the increase in users agreeing that the advice addressed their enquiry in full was driven by employee-side users who saw a significant shift since 2018.
Unsurprisingly, where users found that the advice helped to solve a problem at work, they were more likely than their counterparts to agree with all of the statements shown in Figure 6.5. Also, users that had responsibility for changing policies and passed on the information were also more likely to agree with all statements with the exception of the advice being their main source of information on the employment issue. The exact proportions are shown in Tables 6.1, 6.2 and 6.3.
| Statement | Answered 'Yes' to 'Whether it solved a problem at work' | Answered 'No' to 'Whether it solved a problem at work' |
|---|---|---|
| Was valuable to you | 95% | 44% |
| Helped you decide what to do next | 87% | 35% |
| Gave you the confidence to deal with similar issues in the future | 86% | 33% |
| Covered the topics you were seeking advice on in sufficient detail | 82% | 26% |
| Addressed your enquiry in full | 80% | 23% |
| Statement | Answered 'Yes' to 'Whether it solved a problem at work' | Answered 'No' to 'Whether it solved a problem at work' |
|---|---|---|
| Was valuable to you | 91% | 85% |
| Helped you decide what to do next | 83% | 75% |
| Gave you the confidence to deal with similar issues in the future | 80% | 73% |
| Covered the topics you were seeking advice on in sufficient detail | 78% | 73% |
| Addressed your enquiry in full | 77% | 71% |
| Statement | Answered 'Yes' to 'Whether it solved a problem at work' | Answered 'No' to 'Whether it solved a problem at work' |
|---|---|---|
| Was valuable to you | 95% | 82% |
| Helped you decide what to do next | 86% | 72% |
| Gave you the confidence to deal with similar issues in the future | 86% | 69% |
| Covered the topics you were seeking advice on in sufficient detail | 82% | 70% |
| Addressed your enquiry in full | 80% | 68% |
Users who stated their query was related to COVID-19 (23% of all users) were less likely than those who responded that their query was not related to COVID-19 to agree that the advice gave them the confidence to deal with similar issues in the future (78% vs 72%), covered the topics they were seeking advice on in sufficient detail (78% vs 68%) and addressed their enquiry in full (76% v 65%). This might suggest that the advice regarding that topic is potentially less thorough or missing something users need.
Those who were using the advice on behalf of a third party were more likely than those that were looking on their own behalf to feel the advice was valuable to them (92% vs 87%), helped them decide what to do next (83% vs 77%) and addressed their enquiry in full (80% vs 72%).
Differences by device were present. Users accessing advice on a computer were more likely to agree that the advice was valuable (89% vs 82%), helped them decide what to do next (79% vs 73%) and gave them confidence to deal with similar issues in the future (78% vs 71%). First-time users were also more likely to agree that the advice helped them decide what to do next (80% vs 74%).
Users with a disability were also less positive about the helpfulness of the advice, as they were less likely to agree with the following statements:
- valuable to them (84% vs 89%)
- helped them decide what to do next (71% vs 82%)
- it gave them the confidence to deal with similar issues in the future (73% vs 79%)
- covered the topics you were seeking advice on in sufficient detail (69% vs 79%)
- addressed your enquiry in full (68% vs 77%)
There were some other differences; those working were more likely to agree that the advice helped them decide what to do next (79% vs 66%), male users were more likely to agree that the advice addressed their enquiry in full (78% vs 72%) and younger users were less likely to agree that the advice addressed their enquiry in full (60% of 18-34 years vs 75% of 35-54 and 55+).
Expectation of advice
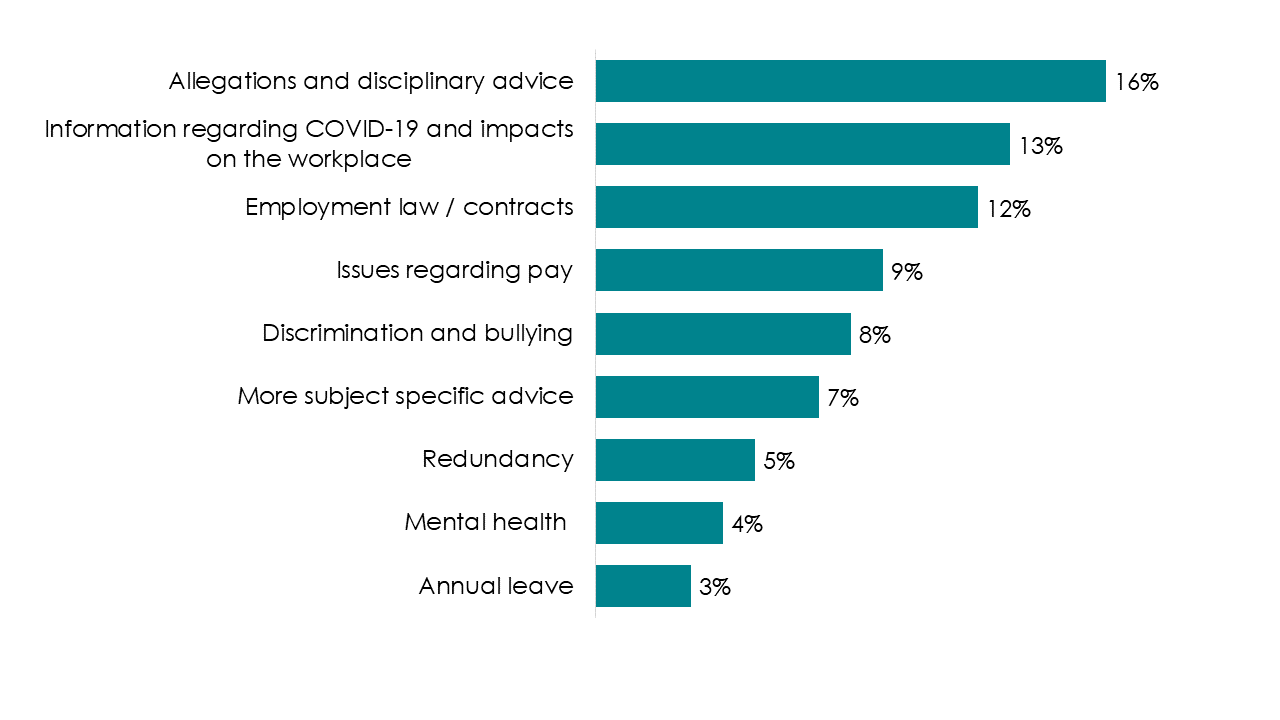
A new question was added into the 2021 evaluation which asked whether users expected to see advice on a topic that was not on the website when they visited. Around 1 in 6 (16%) users expected some advice that was not there; this was more likely to be the case for employee-side users (20%) than employer-side users (12%). In terms of the topics they felt were missing, this varied from advice on allegations and disciplinary advice (16%), employment law or contracts (13%), advice on mental health (4%) and annual leave (3%).
One of the most commonly mentioned topic areas where users expected advice that was not there, was information regarding COVID-19 (13%). This links to the fact that users with a COVID-19 -related query were more likely to have expected advice that was not there (20% vs 15%).
This is detailed further in Figure 6.6.
Considering this list of topics that users felt they could not find advice on, some are in fact present on the advice pages, but from a user perspective, there was something specific regarding that topic that was missing. For example, taking allegations and disciplinary action, users mentioned the time frames associated with this, allegations regarding drugs and alcohol and more specific advice regarding their unique situation.
"I was looking for timescales - there was no information on what timeframes apply when someone is appealing a disciplinary, and how long it is reasonable to give people in different circumstances. These things might be determined by company policy, but if there are statutory or recommended timeframes, it would be helpful to know, and also to know if there are not." Quote from a user.
COVID-19-related information that users felt were missing included specific information about rights on return from furlough, information regarding vaccination and home-testing and more clarity around isolation and pay.
"Lateral flow tests for employees and reporting of results. At one time, it was considered that the employment contracts should include a clause saying LFT were mandatory but that seems to have gone." Quote from a user.
For other topics listed, it varied widely as to exactly what information they felt was missing that they wanted advice on. Though regarding contracts, zero hours contracts and rights as an agency worker were mentioned a number of times.
Employee-side users who expected advice that was not there were more likely to state discrimination and bullying than employer-side users (11% vs 0%). However, employer-side users were more likely to want more advice on employment law or contracts than their employee-side counterparts (20% vs 9%). Around half (47%) of users who felt that the advice pages did not solve their problem stated they expected advice that was not there.
Users who had a disability were more likely to have expected advice on a topic that was not there (20%) compared to those without a disability (14%). In addition, where English was not the user's native language, they were more likely to have expected advice on a topic that was not there (26% vs 16%).
Resolution and reassurance
The majority (84%) of users who were using the advice pages to help solve a problem at work felt that it did to at least some extent. This was again more likely to be the case for employer-side users (93%), with three-quarters (77%) of employee-side users feeling this was the case (shown in Figure 6.7). These proportions were consistent with 2018.
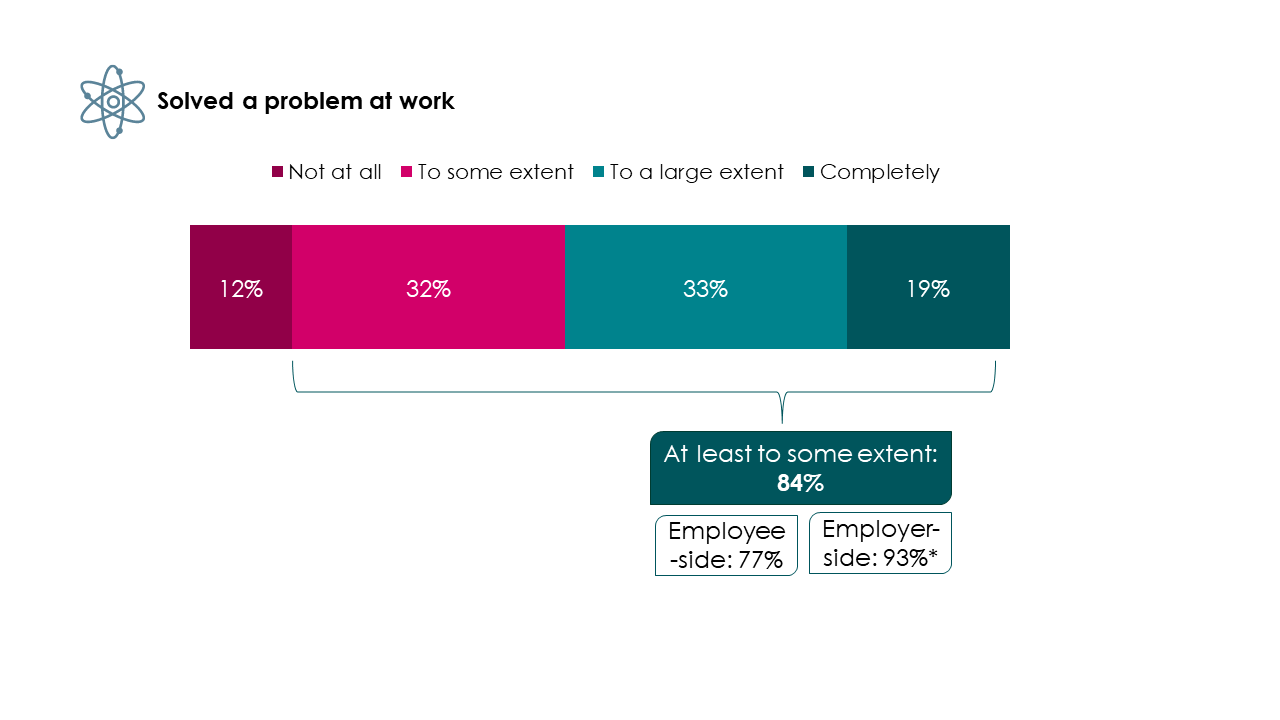
Those who had used the advice pages before were more likely to say that the advice solved their problem to at least some extent (86%) compared with first time users (79%). In addition, those visiting on behalf of a third party were more likely to find it solved their problem than those visiting on their own behalf (89% vs 82%).
The potential gap in COVID-19 information was further evidenced here, with those with a query related to COVID-19 less likely to find that it solved their problem (79%) compared with 86% of those with a query not related.
The following users were also more likely to find that the advice solved their problem at work to at least some extent than their counterparts:
- users who were working at the time of using advice (85% vs 66%)
- those working in not-for-profit or voluntary sector (91%)
- those responsible for changing policies in the workplace (92% vs 80%)
- users who were not disabled (87% vs 79%)
Over half of users (57%) used the advice to reassure them that they had taken the right course of action, as covered earlier in this report. Almost all (96%) of these users felt that it did to some extent, though it only completely reassured users in a third of cases (33%). These findings were consistent with the evaluation in 2018. Employer-side users were more likely to feel that it reassured them of the right course of action than employee-side users (98% vs 95%). This is shown in Figure 6.8.
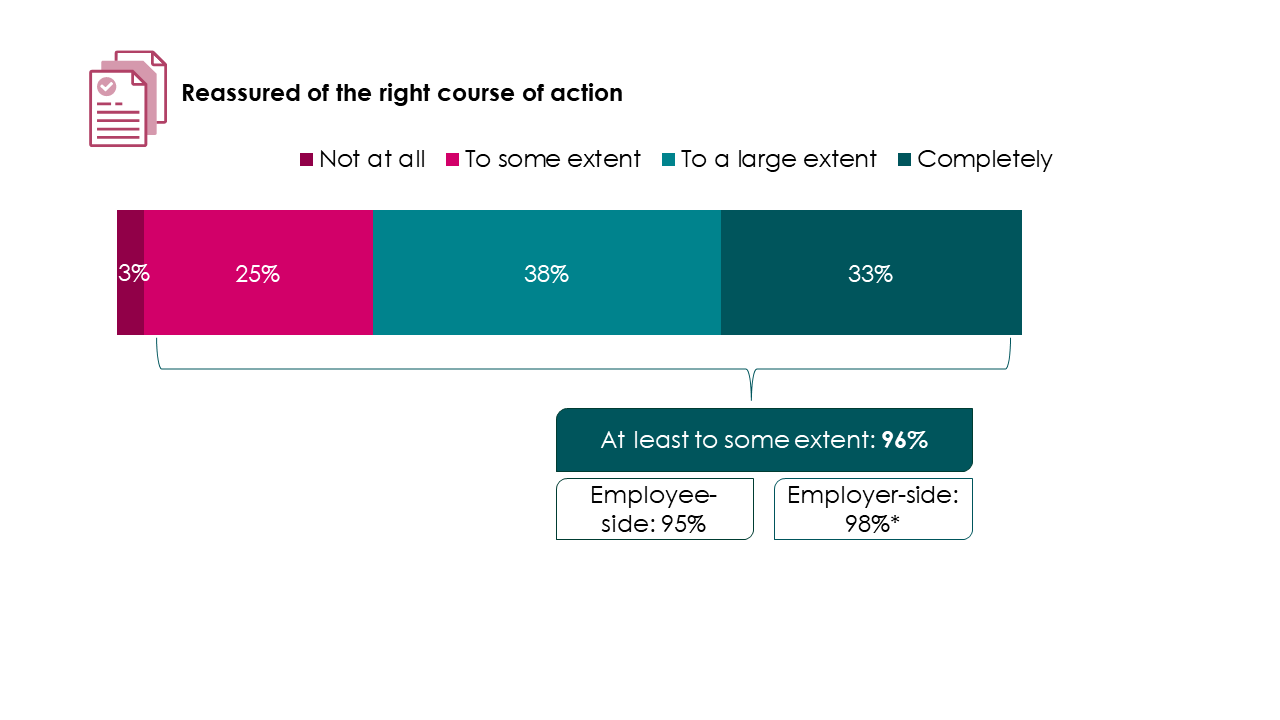
The extent to which the advice reassured users of the right course of action was broadly consistent across different user groups. However, disabled users were less likely to feel that the advice did so (94% vs 97% of those without a disability). Older users were also more likely to state that it reassured them of the right course of action (98% of users over 55 years of age vs 95% of those younger than 55).
Users who had responsibility for changing policies in the workplace (98% vs 95%) and those who passed the information on (98% vs 95%) were also more likely to feel that the advice reassured them of the right course of action to at least some extent.
7. Action taken following advice
This chapter covers the action users took following using the advice pages, as well as other information sought after using it and why. It also discusses any changes to existing and new workplace policies and how the advice relates to claims to employment tribunals and early conciliation notifications.
Key findings
- Use of digital advice triggered more users into action in 2021, when compared with 2018, with a relatively small proportion taking no action at all after using the advice.
- Most commonly, users discussed the problem with management, employees or HR or implemented changes recommended by Acas. Both of these actions were more common amongst employer-side users.
- Employee-side users were more likely than employer-side users to seek advice from another website, person or body and submit a grievance to their employer.
- Compared with 2018, more users were seeking advice in relation to employment tribunals or early conciliation notifications.
Further actions pursued since Acas
The most popular action taken after accessing Acas advice for all users was to discuss the problem with management, employees or HR (49%). This was followed by implementing changes recommended by Acas (33%). Compared with results from the 2018 survey, both outcomes have become more likely. Discussing problems with management has increased by 7 percentage points (previously 42% in 2018) and the percentage of users implementing Acas advice has risen by 9 percentage points (previously 24% in 2018).
Line managers were most likely to use the advice to discuss with other management, employees or HR (74%). Former employees were most likely to go on to seek advice or assistance from another person, body or website after using Acas advice (46%). Those who had a query relating to COVID-19 were also more likely to seek advice from another person, body or website compared with those whose query was not related to COVID-19 (33% vs 26%).
Looking at the profile of users compared with the actions they took after accessing Acas advice, users with a long-term illness, health problem or disability were more likely to submit a grievance to their employer following accessing Acas advice, than those without a health problem (20% vs 10%). Users who did not speak English as their first language were more likely to speak with management, employees or HR after Acas advice than those with English as their first language (64% vs 49%).
There was a significant gender difference between percentages of those submitting a grievance to their employer since using Acas advice pages, with male users much more likely to take this action than female users (20% vs 11%).
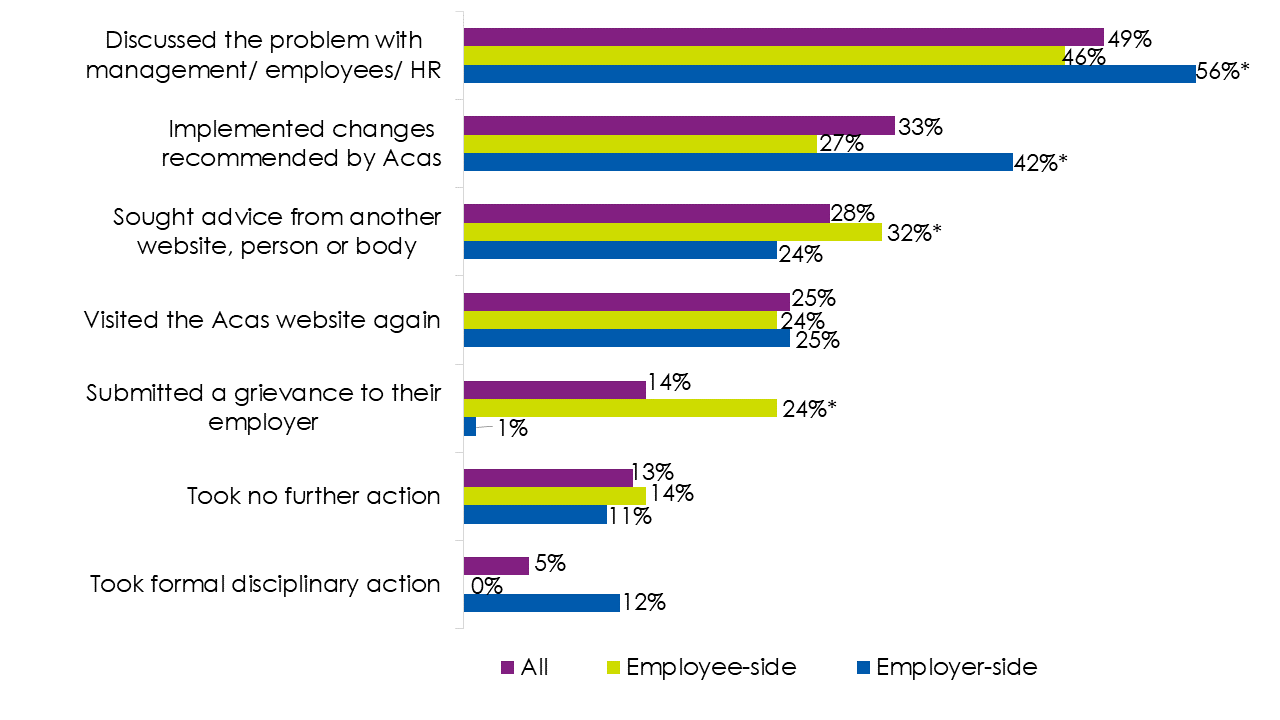
Figure 7.1 illustrates the breakdown of how employee-side and employer-side users went on to use information found on the Acas advice pages. From these results, it is clear that there are some key differences in the actions each type of user is more likely to take after accessing Acas advice.
Employee-side users were more likely to seek advice from another website, person or body (32% vs 24% employer-side) and submit a grievance to their employer (24% vs 1%).
Employer-side users were more likely to go on to discuss the problem with management, HR or employees (56% vs 46% employee-side) as well as much more likely to implement changes recommended by Acas (42% vs 27% employee-side). For users visiting the Acas website again, employee-side and employer-side users were broadly in line with each other at 24% and 25% respectively.
Other information sought since using Acas
Users who said they looked at other web-based advice from other organisations were asked what kind of web-based services they used. As Figure 7.2 describes below, the GOV.UK website was reported to be the most popular source of advice for users who sought advice elsewhere after accessing Acas advice pages (35%). This was followed closely by seeking advice from lawyers or solicitors and trade unions (both at 34%).
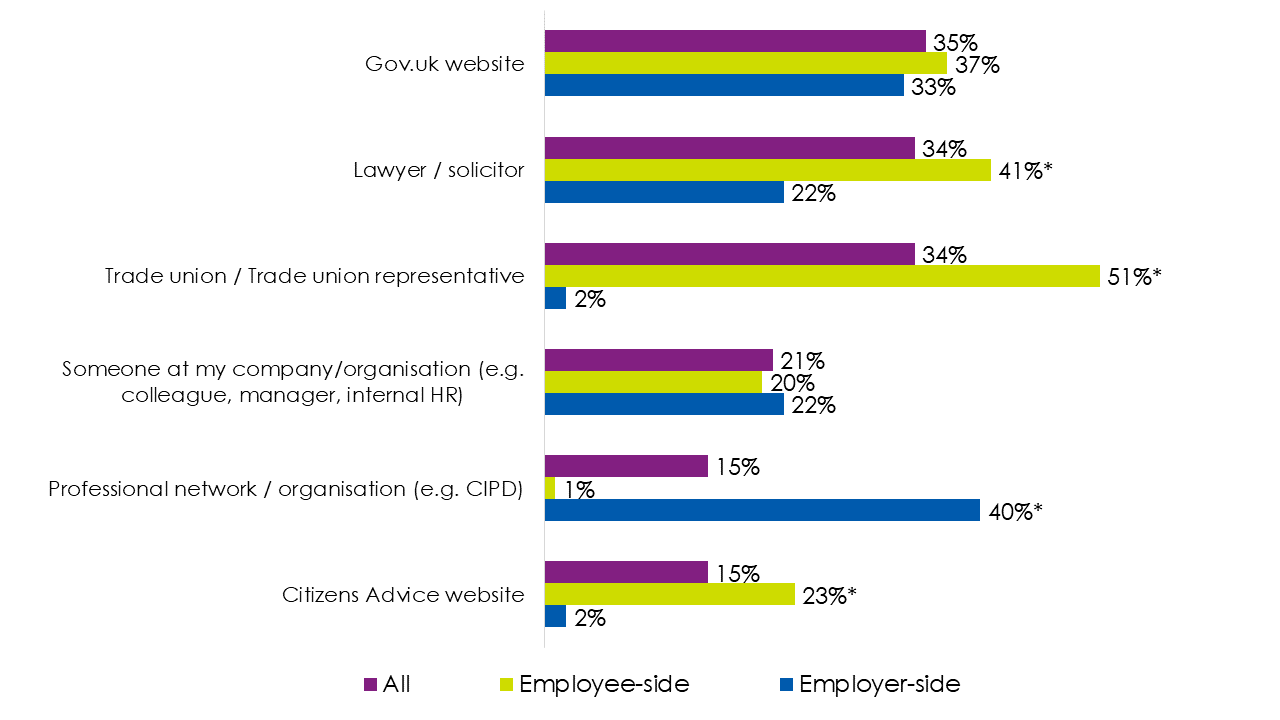
Compared with 2018 survey results for the same question, the percentage of users who looked at other advice using the GOV.UK website has increased by 4 percentage points (previously 31% in 2018), the remaining reasons were broadly in line with 2018 findings.
Other web-based sources mentioned by some users, not included in the chart, were other government department websites (12%) and blogs or online publications and articles (11%). Other users used an external HR advisor or consultancy (10%) or an online HR resource (8%).
Differences in information sources sought after Acas were found to be different between male and female users, with male users more likely than female users to seek advice from a trade union (41% vs 30%). Female users were found to be more likely than male users to seek advice from a professional network or organisation (19% vs 8%).
Users who sought advice from a trade union organisation or representative after accessing Acas advice were more likely to be in the 55+ age group (40%) and had a higher likelihood of being an ethnic minorities user (50% vs 32% of white users).
Users with a long-term health illness or disability were less likely to seek out advice on the GOV.UK website (28% vs 40% without a health problem). However, they were more likely to seek advice from a trade union than those who did not have a long-term illness or disability (47% vs 27%).
Employee-side users were more likely (41% vs 22% employer-side) to seek advice from a Lawyer or Solicitor after looking at Acas advice. They were also much more likely (51% vs 34%) to seek advice from a Trade union/trade union rep.
Employer-side users were more likely to seek advice from a professional network or organisation (40% vs 1%) than employee-side users. Employer-side users were also much more likely to seek advice from external HR advisers (26% vs 1%) and access online HR resources (22% vs less than 1%) than employee-side users.
HR professionals were the most likely to seek advice from a professional network or organisation after reading advice on the Acas website (55% vs 15% total users). Looking at workplace sizes, users from workplaces with more than 250 employees were more likely to seek advice from a trade union after reading advice on the Acas website (53% vs 34% total).
Reasons advice was sought elsewhere after Acas
Users who sought assistance from another body or web-based organisation were asked why they had done so. Amongst these users, the most common reason for seeking advice elsewhere was because they wanted to confirm the information they had read (64%). Another high-ranking reason for seeking advice elsewhere was that they were always planning to use other sources (55%), and that there wasn't enough detail in the advice they had accessed on the Acas advice pages (42%).
71% of users who were seeking advice elsewhere but had felt Acas had solved their problem, used the additional information to confirm what they had already read.
Almost three-quarters of users who were reassured by Acas advice but looked for advice elsewhere, also used the additional information to confirm what they had already read (73%). Of users who were reassured by Acas advice, 61% sought out additional information because they always planned to.
Users who identified as ethnic minorities were more likely to seek additional advice after Acas to confirm the information they had read, compared to white users (84% vs 62%). Half of ethnic minorities users sought additional advice because they could not find the information they were looking for, making them more likely to do so compared to white users (50% vs 27%).
Users who had a long-term health illness, health problem or disability and were looking for additional information after Acas advice, were more likely than those without health problems to seek alternative advice because they didn't understand the information they read on the Acas website (15% vs 8%). In addition, 9% of this group of users sought alternative advice because they found the Acas website hard to navigate (9% of users with health problems or disability vs 3% without).
As can be seen in Figure 7.3 below, when looking at reasons for seeking advice elsewhere amongst employee and employer-side users, the most common 4 reasons were broadly in line with each other, with no significant differences between these 2 groups of users.
However, employee-side users were much more likely than employer-side users to be looking at other information sources after looking at Acas advice due to Acas advice recommending seeking further advice (31% vs 16%), the user not understanding the information (15% vs 2%) or finding the advice hard to navigate (7% vs 2%).
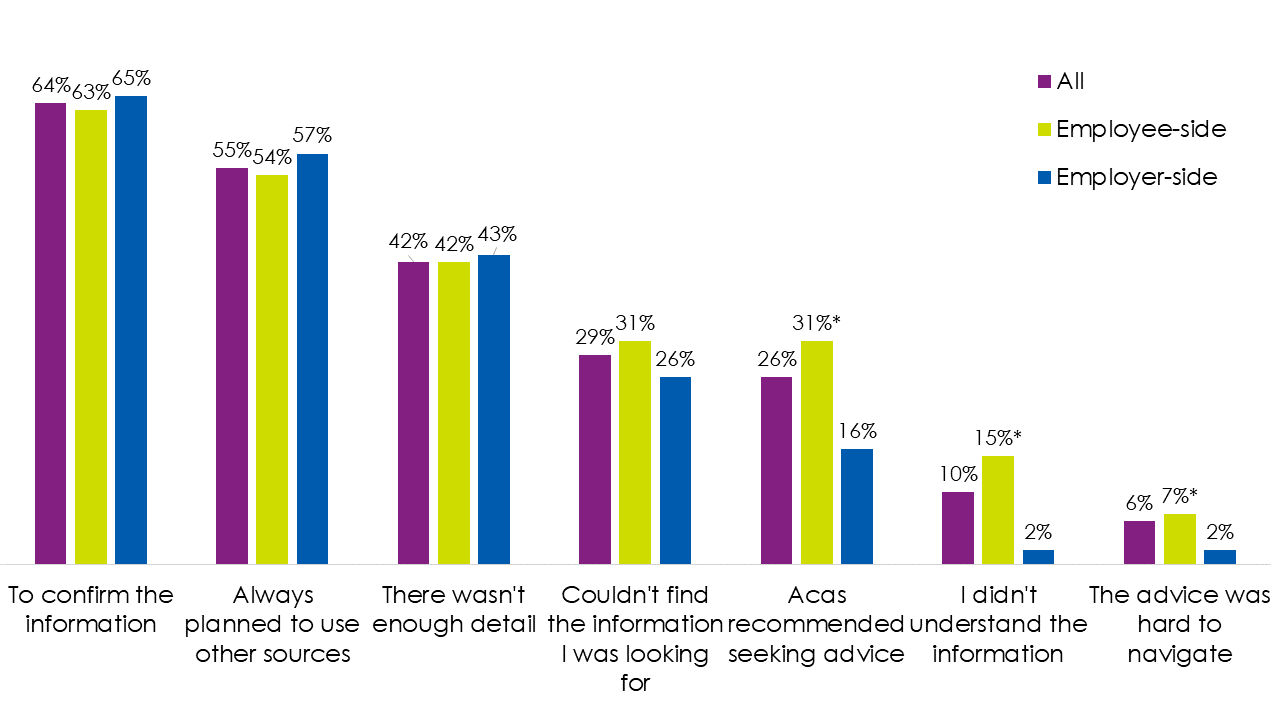
Workplace policy outcomes after using Acas advice
Improving or updating existing policies
Over a third of all users have improved, or plan to improve existing workplace policies as a result of reading Acas advice (37%). This is slightly down by 3 percentage points on 2018, where 40% of users already had or had plans to improve workplace policies.
Users who said they were satisfied with the service were more likely to have already implemented changes following Acas advice, than those who were not satisfied by the service they received (16% vs 3%). Over a third (39%) of users who were satisfied with the service said they either have or will be implementing changes compared to 17% of those who were unsatisfied with the Acas advice they received.
Below, Figure 7.4 illustrates the large differences found between employee-side and employer-side users in answering this question. Employer-side users were more likely than employee-side users to have updated or improved workplace policies as a result of Acas advice (24% vs 8%). Employer-side users were also much more likely to have plans to update or improve workplace policy as a result of accessing Acas advice (32% vs 14% of employee-side users).
Employee-side users were more likely to not have made any changes (47% vs 41%) and to respond that they didn't know if policies had been updated or improved since Acas advice was accessed (31% vs 4%).
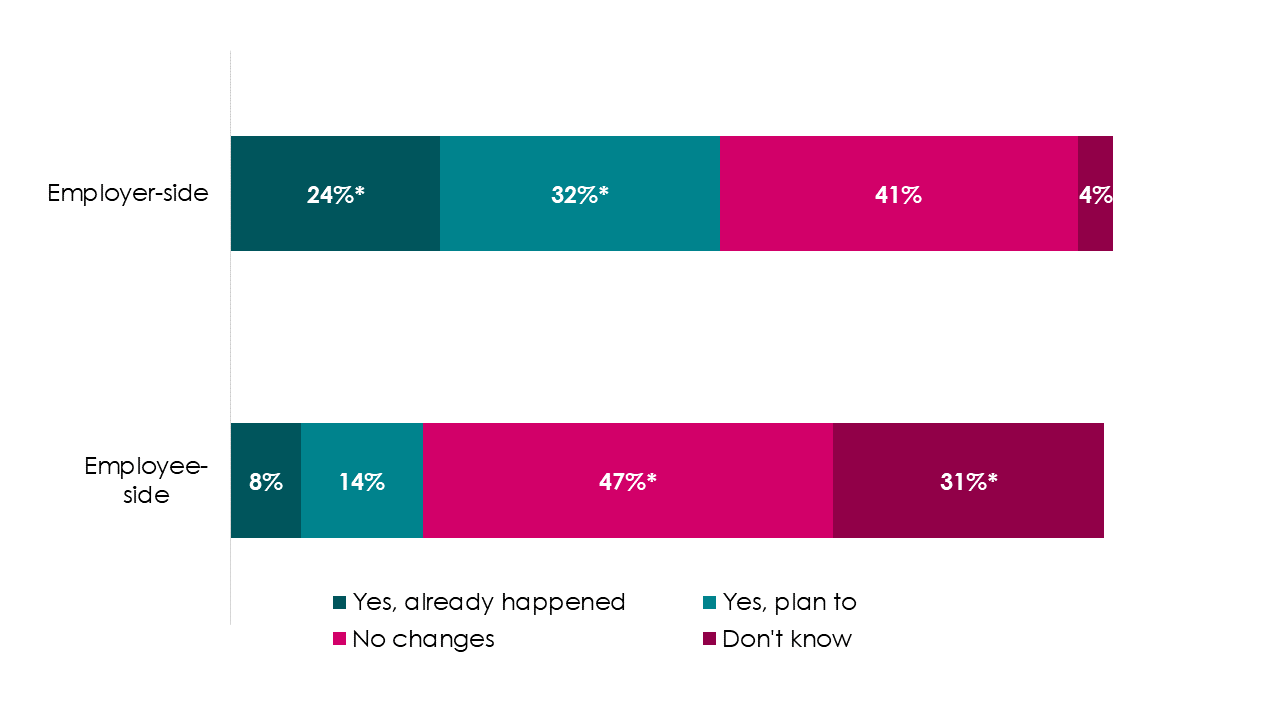
Almost half (49%) of users who skim-read the information on screen have no plans to make changes to their work place. Half (50%) of users who passed the information on said they either have or will be implementing changes to improve or update their workplace policies.
Users who were not in work were much more likely to not know if their workplace policies had been changed as a result of Acas advice (51% vs 17%). Users with a long-term illness, health problem or disability were less likely (32% vs 40%) to have made changes or be making changes within their workplace as a result of accessing Acas advice.
New workplace policies after Acas
Almost a third (30%) of all users had already implemented or planned to implement new policies at their workplace as a result of accessing Acas advice. One in 10 (10%) of all users had already implemented these policies.
Employer-side users were much more likely to have both already implemented and plan to implement new policies, with 45% compared to 19% of employee-side users. Business owners or senior managers were the most likely to have either implemented policies already or plan to (51%) as well as HR professionals (45%) and line managers (45%).
Users who had used Acas advice before were much more likely to have implemented or be planning to implement new workplace policies as a result of Acas advice (34% vs 18% of those who had not used Acas before).
Users accessing Acas advice on a computer were more likely to have implemented or be implementing new policies after accessing Acas advice than those using a mobile phone or tablet (34% vs 18%). Users who downloaded or saved the Acas advice, or copy and pasted it into their own document were more likely to have created new workplace policies or be planning to after reading Acas advice (38% and 37%).
Users who had a long-term illness, health problem or disability were less likely to have implemented, or plan to implement new workplace policies after accessing Acas advice (24% vs 34% of users without health problems).
Employment tribunals as a reason for visiting Acas
Employers seeking Acas advice
Around 1 in 8 (12%) employers, managers or employer representatives looked at Acas advice due to concerns that one or more of their employees was considering making a claim to the employment tribunal, as illustrated in Figure 7.5. Users who were employer representatives were most likely to view Acas advice on behalf of an employee who was considering making a claim to the employment tribunal compared with line managers and business owners or senior managers (22% vs 10% and 9%).
Just under a third (32%) of employer-side users where the main subject they were looking for advice on was discipline, dismissal, or grievance used the Acas advice service due to a concern that their employee(s) were making a claim to the employment tribunal.
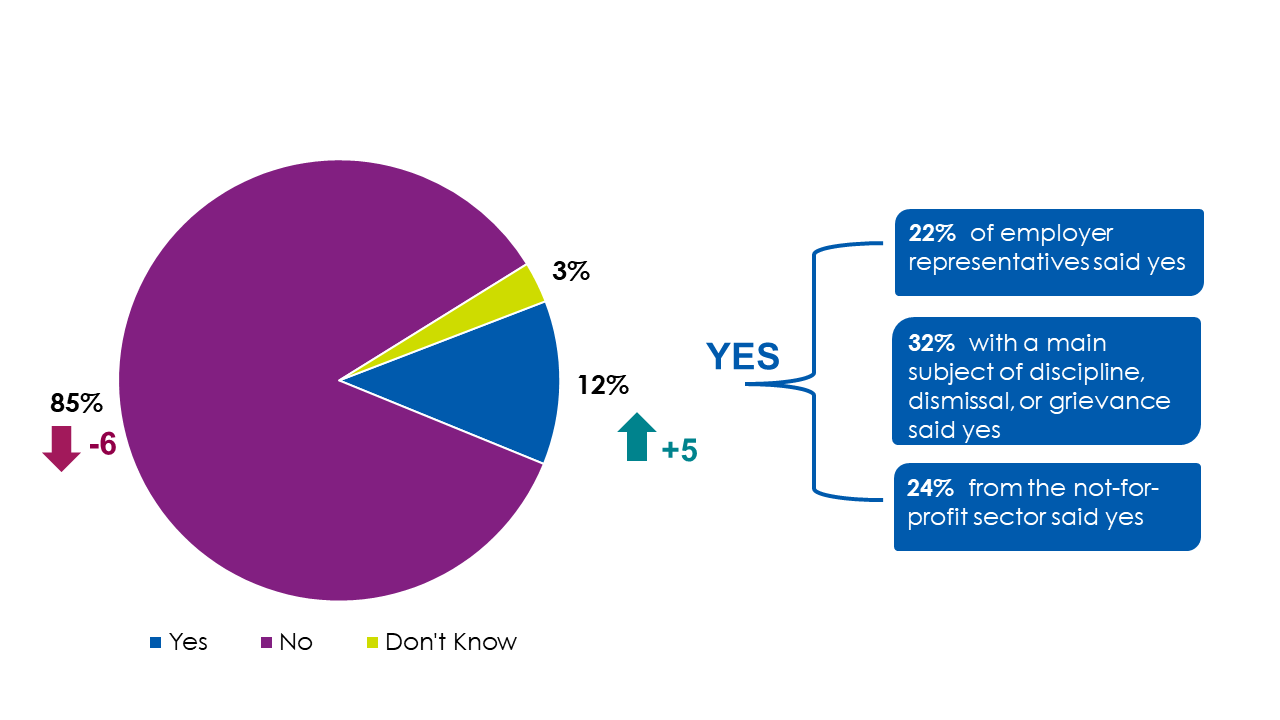
Almost a quarter (24%) of employer-side users from the not-for-profit or voluntary sector looked at Acas advice due to concerns that one or more of their employees was considering making a claim to the employment tribunal, compared with 7% of employer-side users in the private sector, and 21% in the public sector.
Employer-side users who were trade union members were more likely to look at Acas advice in relation to concerns that one or more of employees was considering making a claim to the employment tribunal (24% vs 11% who were not members).
Employees seeking Acas advice
Compared with 2018, there was an increase of 4 percentage points in employee-side users who made an employment tribunal claim or early conciliation notification, as can be seen in Figure 7.6 (12% vs 8% in 2018). There was also a slight increase in those who had not yet taken action, but did plan to (30% in 2021 vs 28% in 2018). Over a third (37%) of users who were a former employee said they made an employment tribunal claim or an early conciliation notification after referring to Acas advice.
When looking at the profile of users who did make a claim or submit a notification, these users were more likely to have visited Acas on their own behalf rather than on behalf of a third party (14% vs 7%). Users not in work at the point of contact were also more likely to make a claim or notification after accessing Acas advice than users in work (44% vs 10%). Additionally, users who printed the information directly from the website were more likely to make a claim or notification (25%).
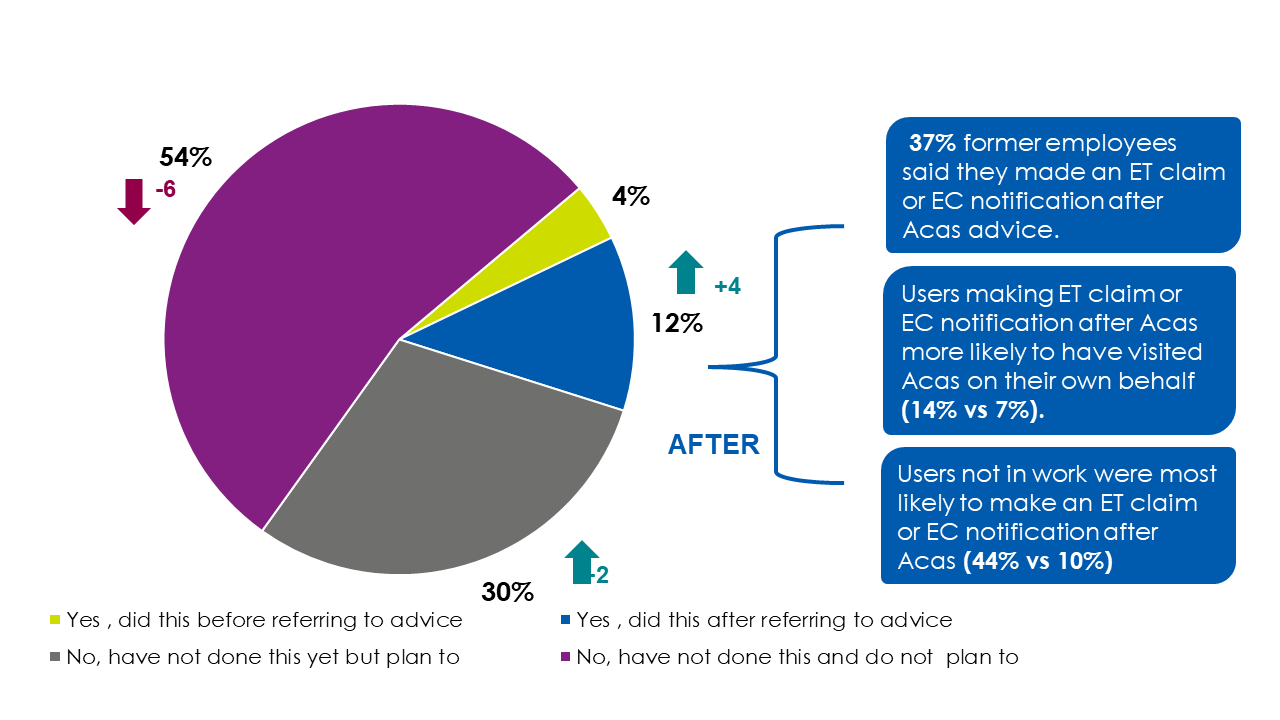
Another significant difference in users who had submitted or planned to submit a claim or notification was an increased likelihood of users being from a workplace of more than 250 people (20%), or from a public sector workplace (18% vs 12% in private and 11% in not-for-profit).
Users who did not speak English as their native language were more likely to not have submitted but did plan to do so, compared to those who spoke English as their native language (43% vs 29%).
When looking at the least likely employee-side users to submit a claim or notification, users from organisations with fewer than 50 employees were the least likely to have submitted or have any plans to do so (67%). Female users were also less likely than male users to have made an employment tribunal claim or early conciliation notification, or have plans to do so (58% of female users vs 47% of male users reported no plans to make a claim).
Passing on Acas information
Whether the information was passed on
Overall, 43% of users passed on the information they received from Acas, as can be seen in Figure 7.7 below. Employer-side users were more likely to do this, with 58% vs 32% of employee-side users. Users in the not-for-profit sector were more likely than any other sector to pass on the information (57%). Compared with 2018, employee-side users were less likely to pass on the information (37% in 2018 vs 32% in 2021), but employer-side more likely (55% in 2018 vs 58% in 2021).
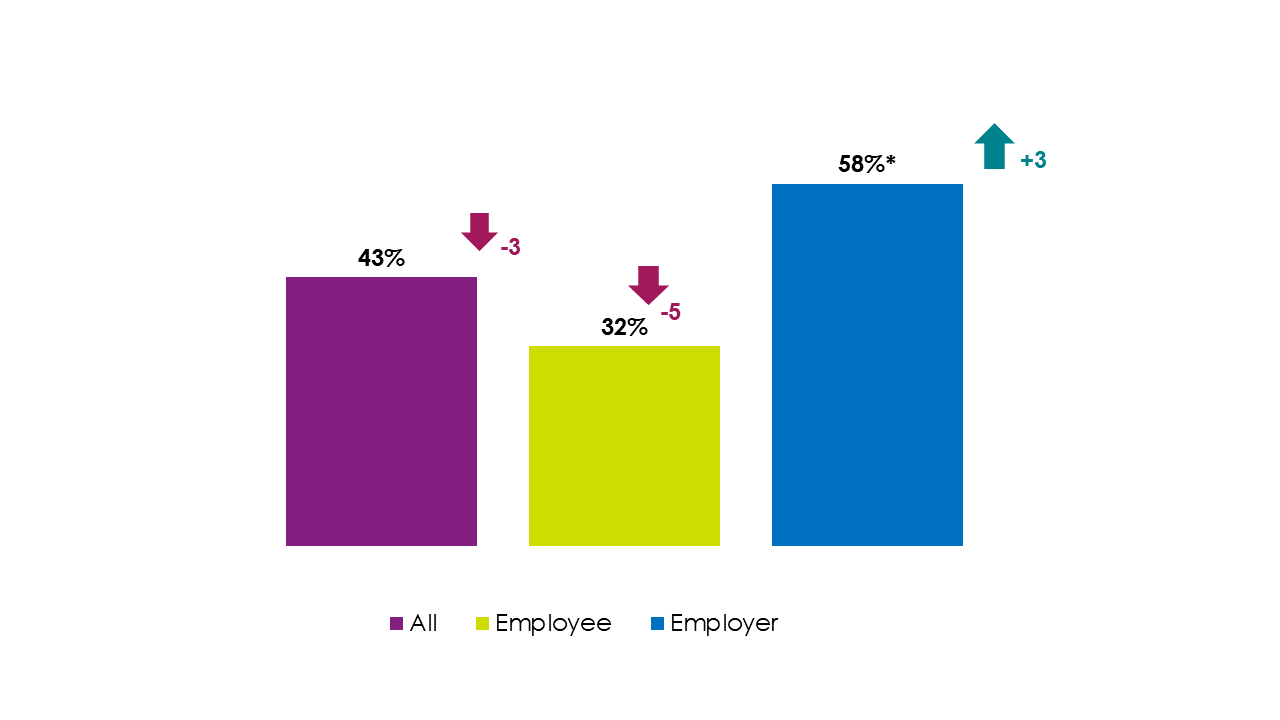
Users who were in work were more likely to pass on the advice they had received (44% vs 20% of users not in work). Of user role types who were more likely to pass on the information to others in their organisation, line managers (67%) and business owners (66%) were most likely to do this. Looking at which sectors users were from, users were more likely to pass on the advice if they worked in the not-for-profit or voluntary sector (57% vs 41% and 25%).
Users looking for advice on contracts and working arrangements (53%) and users who had a main call subject of holidays, working time and rest breaks (50%) were also more likely to pass the information on than users who accessed Acas advice for other types of queries. Half of users who had their problem solved by Acas advice passed the information they received on to someone else in their organisation (50%). Similarly, users who felt reassured by Acas advice, and those who were satisfied with the advice they received were much more likely to pass the advice on than those who were not reassured or satisfied (50% of users with problems solved vs 21% who hadn't; 46% of users who felt reassured vs 22% of users who were not).
Looking at how the advice was accessed, users accessing Acas advice on a computer were more likely to pass the information on than those using a mobile device (47% vs 29%). Users who skim-read the information on screen were most likely to not pass the information on (59%).
Who Acas information was shared with
Considering the users who passed on Acas information to others within their organisation, senior managers were the most likely to be sent Acas information (42%) with the user's immediate line manager being the second most likely (34%), as can be seen in Figure 7.8 below.
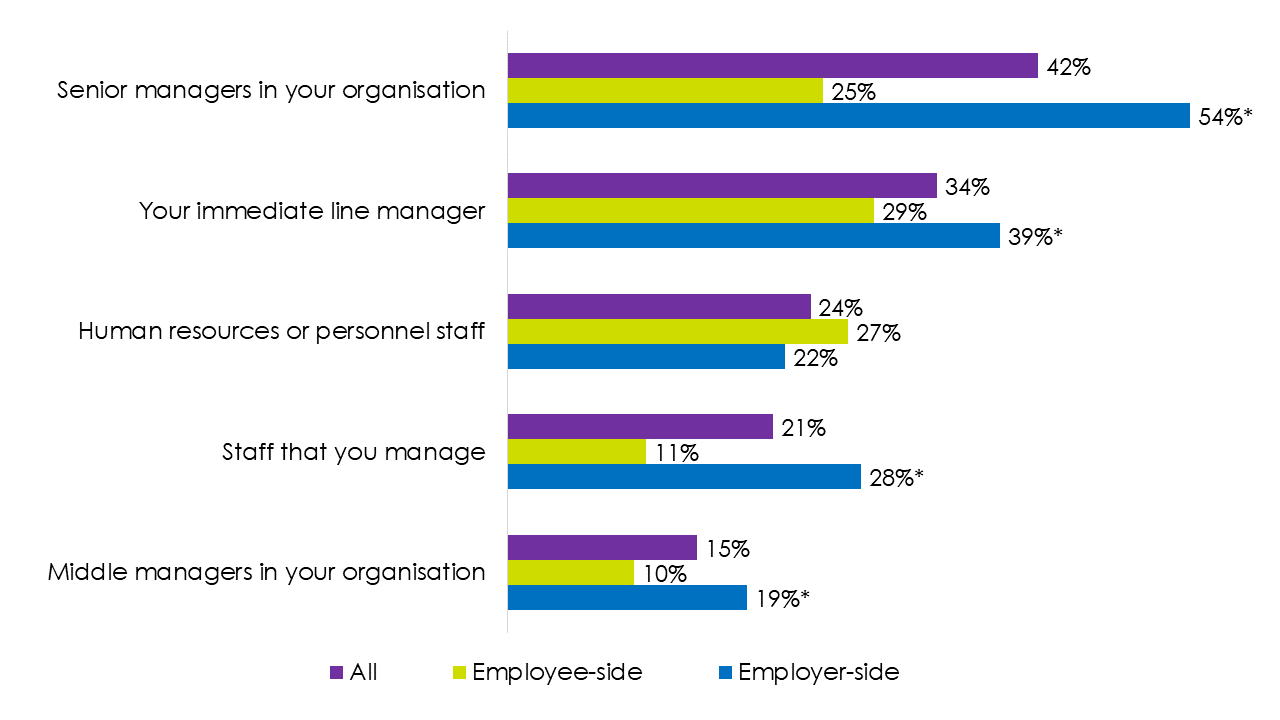
For employer-side users, senior managers were the most likely contact for the information to be passed on to (54%) along with immediate line managers (29%). For employee-side users, other employees (unspecified) were the most likely (28%) along with human resources or personnel staff (27%) and trade union representatives (25%). Users who worked for the not-for-profit or voluntary sector were more likely to pass Acas information on to senior managers compared to all other sectors (55% vs 42% and 35%).
Users looking for themselves were most likely to pass the information on to HR (30%) or senior managers (45%) and those looking on behalf of an employee were most likely to pass to a trade union rep (38%).
Users who identify as ethnic minorities and users with long-term illnesses and disability were more likely to pass the information on to a trade union rep compared with white users (29% vs 11%) and those without illness and/or disabilities (23% vs 8%). Users who did not have a long-term health issue or disability were more likely to pass the information on to their line manager, than those who did (38% vs 27%).
Male users were also more likely than female users to pass the information on to a trade union rep (24% vs 8%).
Users who accessed Acas advice by using a computer were also more likely to pass the information on to senior management compared with those who read the advice on a mobile phone (45% vs 27%).
8. Conclusions
User experience
Overall, user experience was positive in 2021.The majority (87%) of users were satisfied with their experience and found the advice easy to access (84%), consistent with 2018. In both cases, employer-side users were more positive than employee-side users. This pattern continues to emerge throughout the findings and consideration is required as to how Acas can improve the experience of employee-side users.
In terms of the helpfulness and perceptions of the advice, the majority of users were positive.
Since 2018, more users felt the advice was:
- valuable to them (an increase of 3 percentage points)
- helped them decide what to do next (an increase of 4 percentage points)
- gave them the confidence to deal with similar issues in the future (increase of 3 percentage points)
- addressed their enquiry in full (an increase of 4 percentage points)
- presented in an impartial way (an increase of 3 percentage points)
Often, these increases were across all types of users, although employer-side users have driven the increase in the proportion agreeing the advice gave them the confidence to deal with similar issues in the future. However, employee-side users drove the increase in the proportion who felt the advice addressed their enquiry in full.
Familiarity with the Acas advice pages varies by user, and often first-time users differ in their opinions of the advice when compared with repeat-users. Those who had used the advice before were more positive; they were more likely to be satisfied and find the advice easy to access. In addition, they were more likely to agree that the advice they looked at helped them decide what to do next, was trustworthy and was presented in a way they easily understood. Unsurprisingly, first time users were more likely to say that it was their main source of information for this employment related issue. It is worth noting that employer-side users were more likely to be repeat-users and are generally more positive. Acas could investigate and remove any barriers for first-time users to ensure content is easy to access, trustworthy and understandable.
Users who had a query that was specifically related to COVID-19 were more likely to find that there was a topic missing from the website that they expected to see when they visited (20%). They were also less likely to feel that the advice gave them the confidence to deal with similar is-sues in the future, covered the topics they were seeking advice on in sufficient detail and addressed their enquiry in full than those whose query was not related to COVID-19. This indicates that there is a gap in the information on the Acas advice pages regarding COVID-19 and associated issues that needs to be addressed. However, as the COVID-19 pandemic is a landscape that is constantly changing with regards to rules and guidance, the advice pages may become less relevant more quickly, requiring more frequent reviewing and updates.
Another positive shift since 2018 concerned the length of the advice. Fewer users in 2021 felt that the advice was too long, and users were more likely to split the advice over 2 or more sessions. Despite splitting digesting the advice over more sessions, it is not perceived to be too long, therefore indicating that the length is striking the right balance.
User journey
In light of the COVID-19 pandemic, more users were visiting the advice pages with a specific workplace query that they wanted to find the answer to, and fewer were looking for information on a topic more generally compared to 2018. In terms of reaching the advice pages, in 2021, fewer users went straight to the Acas advice pages than in 2018 and more users were visiting GOV.UK beforehand compared with 2018.
The type of device used also differed in 2021, with more users accessing the advice on their personal computers or mobile phones. Again, this is likely to be a direct impact of the COVID-19 pandemic with an increase in those working from home.
In terms of the use of the Acas helpline, more users were calling the Acas helpline at any point during their journey of using Acas advice when compared with 2018. However, with regards to when they called the Acas helpline, fewer users were only calling after they looked at the advice, though more were calling at the points both before and after. The main reasons for calling the Acas helpline after visiting the advice pages were that users wanted to confirm information and that they didn't feel there was enough detail on the advice pages.
Acas should review whether the information could be made even clearer to avoid the need for confirmation. Improvements here should decrease the proportion of users who feel they need to call the Acas helpline following their visit to the advice pages.
Subsequent actions
Positively, the digital advice has triggered users into action more in 2021, compared with 2018. This was most commonly discussing the problem with management, employees or HR, followed by implementing changes recommended by Acas. Employer-side users were more likely to do both of the above than employee-side users. Actions more likely to be undertaken by employee-side users than employer-side users were seeking advice from another website, person or body and submitting a grievance to their employer.
It may be the nature of the queries causing this, or it could be the nature of the revised digital advice 'nudging' people into action.
In addition, more users were seeking advice in relation to employment tribunals or early conciliation notifications than in 2018. Specifically, employer-side users were seeking advice due to concerns that one or more of their employees was considering making a claim to an employment tribunal and more employee-side users were planning to or making an employment tribunal claim or early conciliation notification after looking at the advice.
As this is an area of increased prevalence, this could be an area for Acas to focus on when making changes or improvements to the advice pages.
9. Technical annex
Sampling
It was estimated that around 52,000 users visited the advice pages each week, totalling around 468,000 over a 9-week opt-in period.
Table 9.1 shows the opt-in rate and online or telephone response rates achieved in the 2021 evaluation (a total response rate from the opt-in sample of 46% – equating to a robust base size of 1,318 in total).
Table 9.1 Actual opt in and response rates
| Exposed to pop-up invite | Opt-in rate | Online response rate | Telephone response rate | Total response rate |
|---|---|---|---|---|
| 259,000 | 1% (2,850) | 27%, (758) | 27% (560) | 46% (1,318) |
For comparison, Table 9.2 shows the same information for the 2018 evaluation (against which comparisons are made throughout this report). In 2018, the opt-in rate was estimated to be slightly higher although the overall response rate was similar (although with more respondents completing online).
Table 9.2 Assumed opt-in and response rates based on 2018 data
| Exposed to pop-up invite | Opt-in rate | Online response rate | Telephone response rate | Total response rate |
|---|---|---|---|---|
| 259,000 | 2% (5,698) | 33%, (1,904) | 22% (826) | 48% (2,730) |
The lower opt-in rate is likely due to a change in how the pop-up was designed in 2021. In order to meet accessibility guidelines it was less intrusive on screen when compared with the 2018 pop-up.
With regards to the make-up of the sample, there were no specific quotas or groups targeted – a random probability approach was taken. All users who opted in and gave valid contact details were invited to take part and the sample exhausted to maximise response.
Methodology
Fieldwork was conducted between 27 April and 29 July 2021 using a pop-up invitation to take part in the survey on the Acas digital advice pages. IFF research contractors contacted respondents to the pop-up in 9 'cohorts' to ensure that users were contacted between 1 to 2 weeks after visiting the advice pages. This allowed enough time for users to have acted on the advice, while still recalling it clearly. This also ensured the approach was the same as 2018.
Timeline of fieldwork
- Invited respondents by email to take part in the survey between 1 and 2 weeks after visiting the advice pages.
- Sent an email reminder 2 days after their initial invitation.
- Sent a second email reminder 5 days after the first reminder.
- Called respondents 2 days after the second email reminder if they had not yet completed the survey.
A total of 758 people completed the survey online and 560 people completed the survey over the telephone.
Analysis
The data was collated, and tables were run with key subgroups added as breaks so significance testing could be applied. The significance testing used on the tables were z-tests to the 95% confidence level. A result is statistically significant if it is unlikely to have occurred by chance and it simply means there is statistical evidence of a difference between 2 figures; it does not mean the difference is necessarily large, important, or significant in the common meaning of the word. A statistical difference can still occur if the percentage point change is very small due to the large base sizes included in the dataset.
Questionnaire
To request a copy of the survey questionnaire, email research@acas.org.uk.