1. Introduction and main points
This quarterly statistical bulletin uses the Acas helpline data capture system (DCS) data to highlight trends seen within the Acas helpline service. The latest data in this bulletin was collected in April to June 2026 (quarter 1 2026 to 2027).
All values in this bulletin are rounded to zero decimal places unless specified otherwise.
- the helpline service handled around 130,300 calls this quarter, around an 8% decrease compared to the previous quarter
- around 88% of calls handled were from workers, while around 7% were from employers
- the most common call topic this quarter was discipline, dismissal and grievance, with around 38% of calls related to this topic
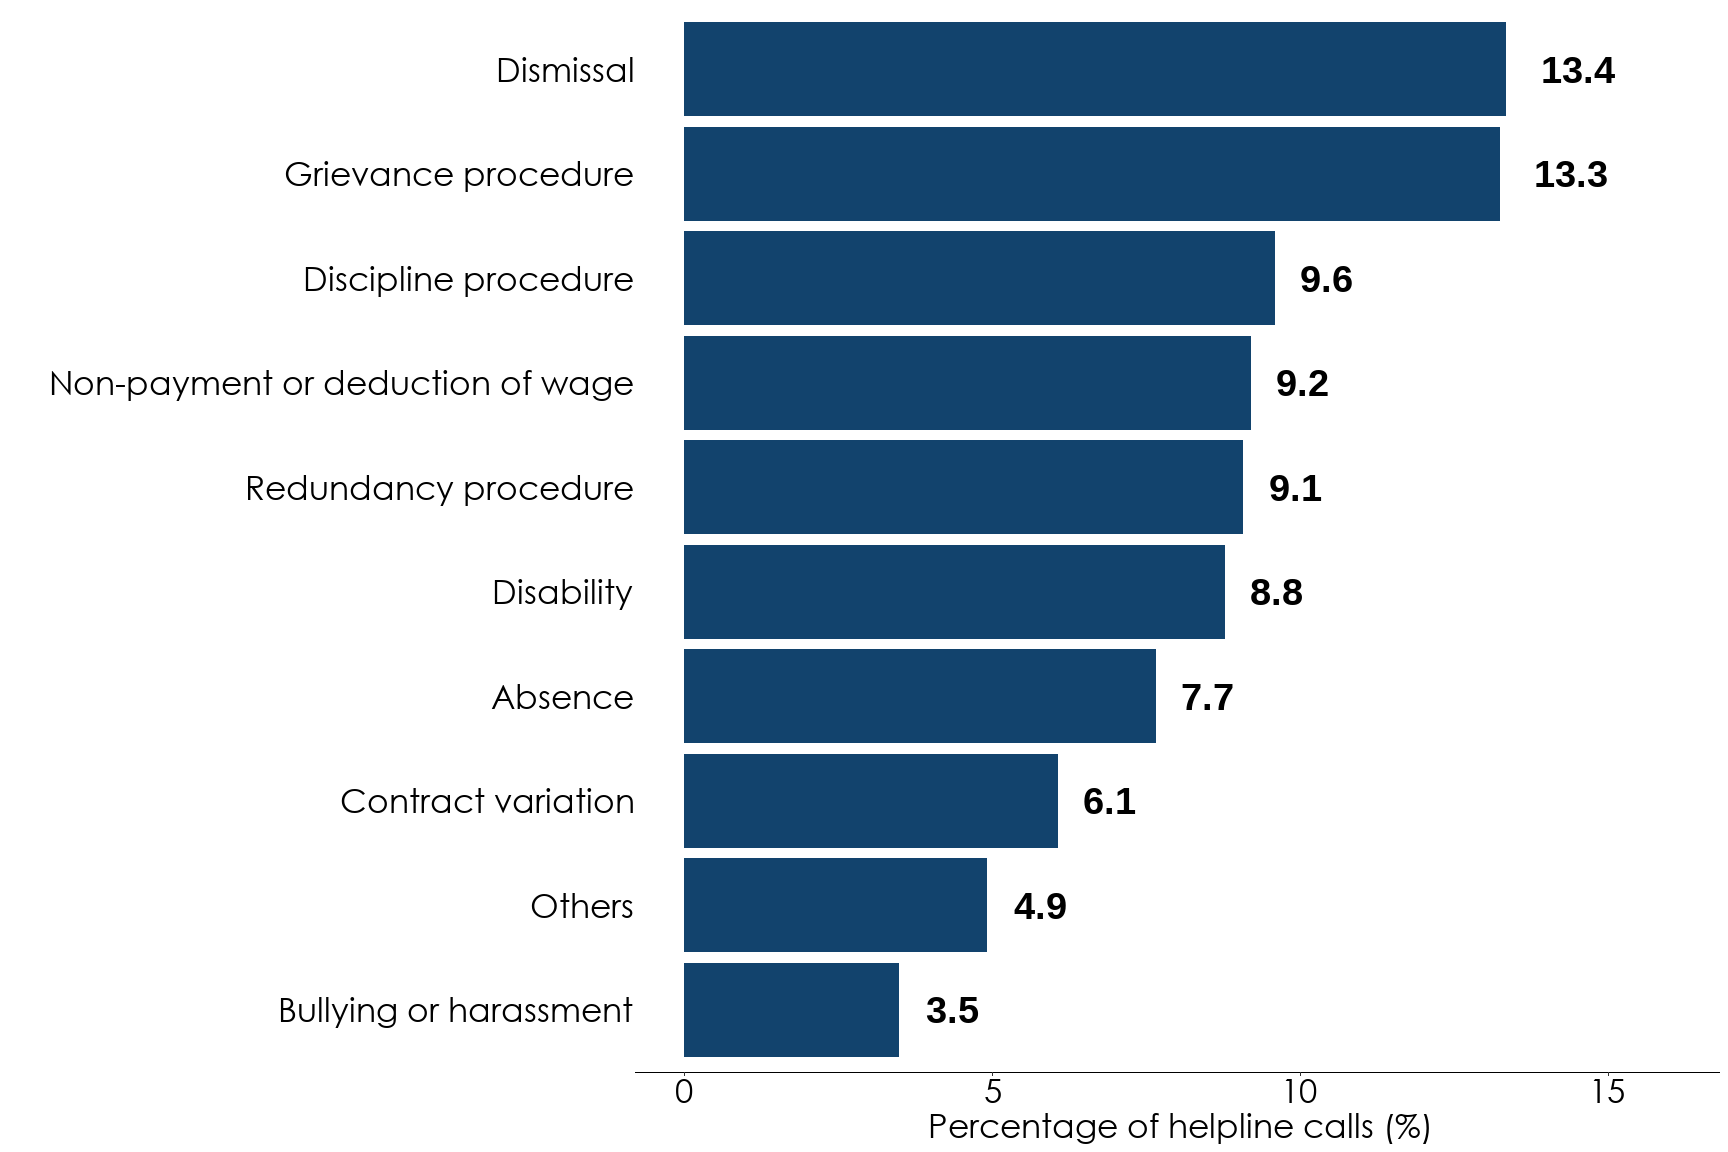
- the most common call subtopics this quarter were dismissal (13%), grievance procedure (13%), and discipline procedure (10%)
- workers were most likely to call the helpline with queries relating to discipline, dismissal and grievance, diversity and discrimination, and wages and National Minimum or Living Wage
- employers were most likely to call the helpline with queries relating to absences, sickness and stress, holiday and working time, and maternity, paternity and adoption
2. Who is calling the helpline?
Call volumes
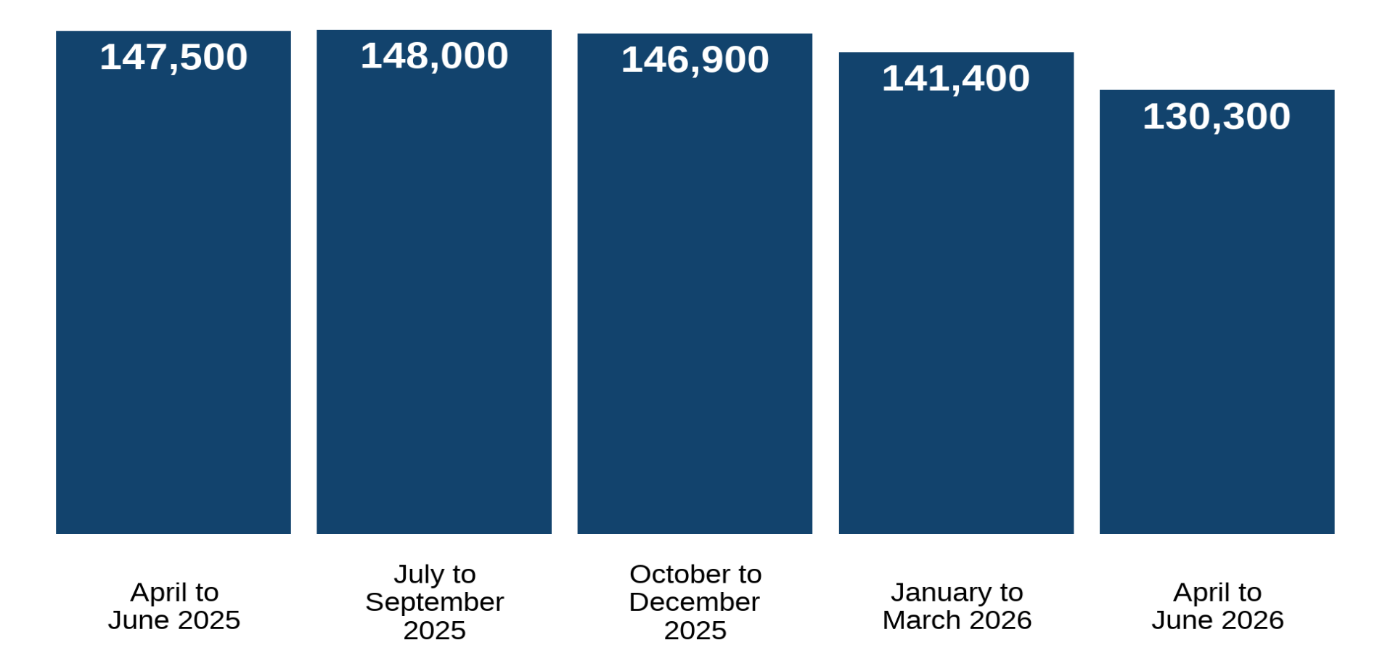
The helpline handled around 130,300 calls in April to June 2026. This is roughly an 8% decrease compared to the previous quarter and roughly a 12% decrease compared to the same quarter last year. Values in Figure 1 have been rounded to 4 significant figures.
| Quarter | Call volume |
|---|---|
| April to June 2025 | 147,500 |
| July to September 2025 | 148,000 |
| October to December 2025 | 146,900 |
| January to March 2026 | 141,400 |
| April to June 2026 | 130,300 |
Calls from workers include calls from:
- employees
- third parties on behalf of employees
- agency workers
- apprentices
- interns
Calls from employers include calls from:
- employers
- third parties on behalf of employers
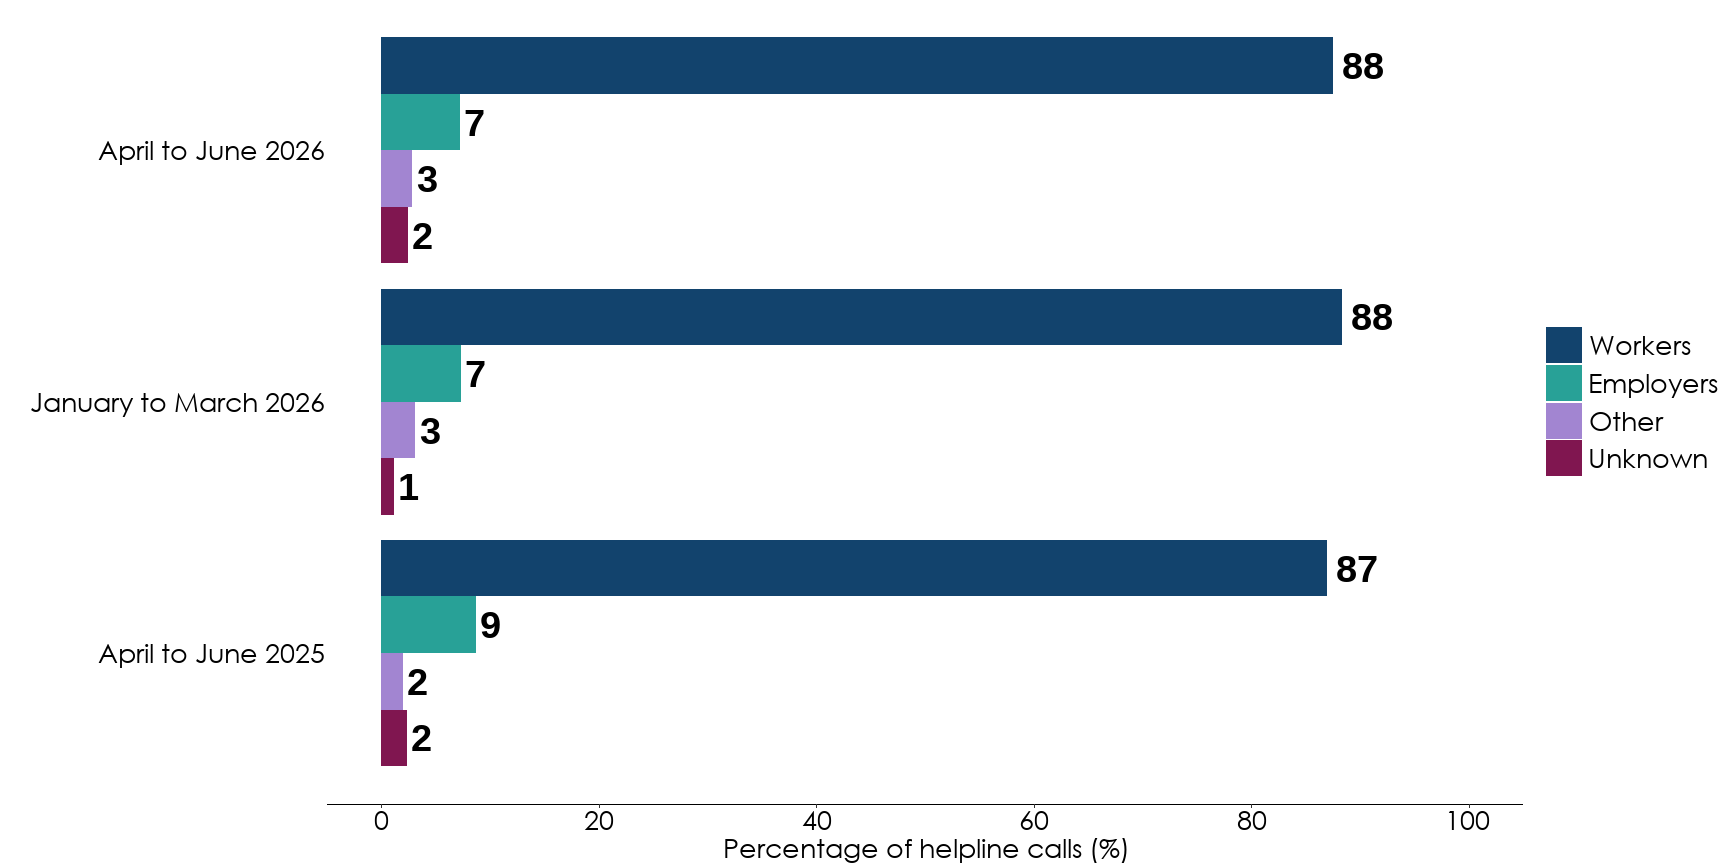
Of the calls handled this quarter, 88% were calls from workers and 7% were from employers. This is similar to the previous quarter, where 88% of calls were from workers and 7% were from employers. In quarter 1 last year, 87% of calls were from workers, while 9% were from employers.
Note: The legend order reflects the order of the categories across the bars.
| Type of caller | April to June 2025 | January to March 2026 | April to June 2026 |
|---|---|---|---|
| Employers | 9% | 7% | 7% |
| Other | 2% | 3% | 3% |
| Workers | 87% | 88% | 88% |
| Unknown | 2% | 1% | 2% |
3. What are people calling about?
Call topics
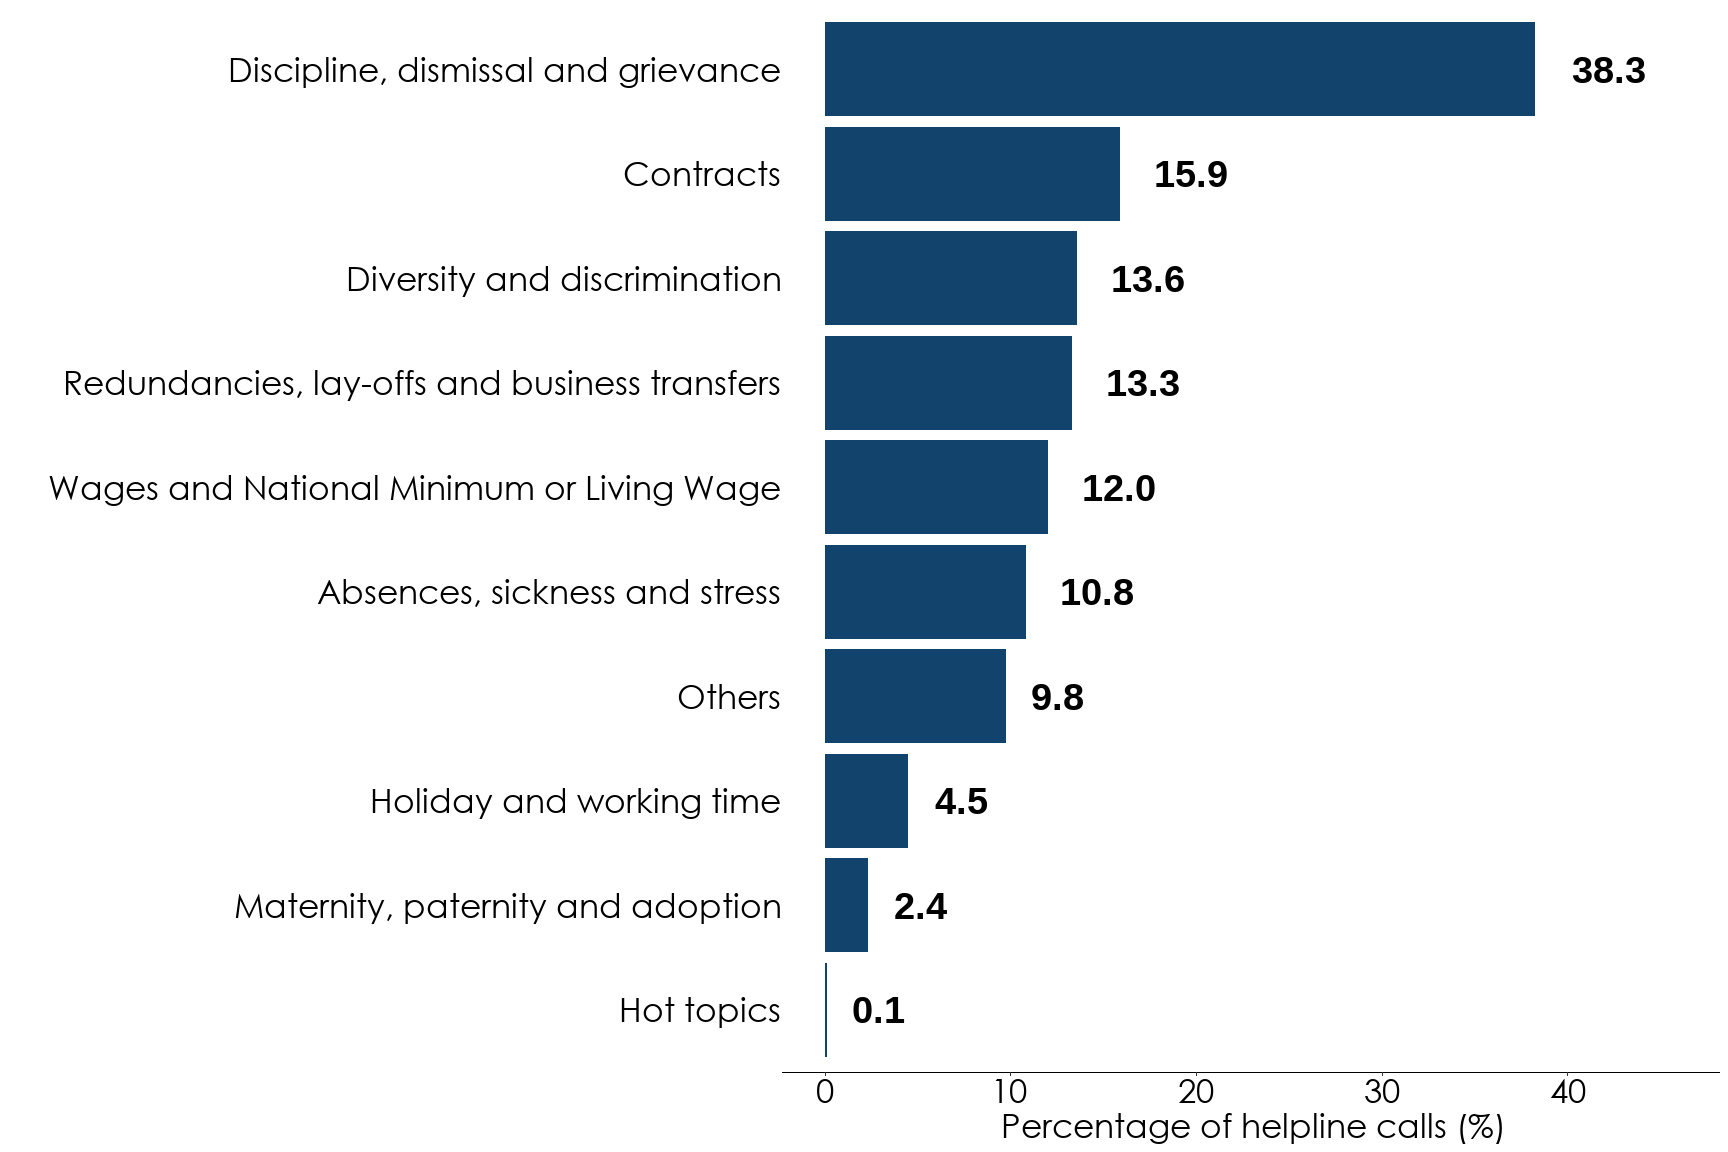
Each data capture system record can be assigned multiple call topics. These are assigned manually by the adviser and are based on the subjects discussed during a call. The most common call topics in this period were:
- discipline, dismissal and grievance (38% of data capture system records)
- contracts (16%)
- diversity and discrimination (14%)
Note: Data capture system records can be assigned multiple call topics, therefore percentages may not add up to 100%.
| Call topic | Percentage of helpline calls |
|---|---|
| Discipline, dismissal and grievance | 38.3% |
| Contracts | 15.9% |
| Diversity and discrimination | 13.6% |
| Redundancies, lay-offs and business transfers | 13.3% |
| Wages and National Minimum or Living Wage | 12.0% |
| Absences, sickness and stress | 10.8% |
| Others | 9.8% |
| Holiday and working time | 4.5% |
| Maternity, paternity and adoption | 2.4% |
| Hot topics | 0.1% |
Table 1 highlights the change in the percentage of data capture system records with each call topic. These are compared with the previous quarter and the same quarter in the previous year. A positive change means that a particular call topic was more common in the most recent quarter.
| Call topic | Percentage of helpline calls in April to June 2026 | Percentage point change versus January to March 2026 | Percentage point change versus April to June 2025 |
|---|---|---|---|
| Discipline, dismissal and grievance | 38.3% | -1.4 | -2.1 |
| Contracts | 15.9% | -0.3 | 0.2 |
| Diversity and discrimination | 13.6% | -1.0 | -0.1 |
| Redundancies, lay offs and business transfers | 13.3% | -0.2 | -0.7 |
| Wages and National Minimum or Living Wage | 12% | -0.1 | -0.2 |
| Absences, sickness and stress | 10.8% | 0.1 | 1.4 |
| Others | 9.8% | -1.8 | -1.5 |
| Holiday and working time | 4.5% | -0.7 | -0.8 |
| Maternity, paternity and adoption | 2.4% | -0.4 | -0.6 |
| Hot topics | 0.1% | 0.0 | 0.0 |
Change from period to period tends to be very small, though year- on- year changes can be more significant and highlight emerging issues. However, the percentage of calls about each call topic have remained stable over the last 12 months. This suggests the issues that have been affecting employees and employers over the last year have not changed much.
Call subtopics
Each call topic also has a number of subtopics. Up to 10 subtopics can be selected in each data capture system record.
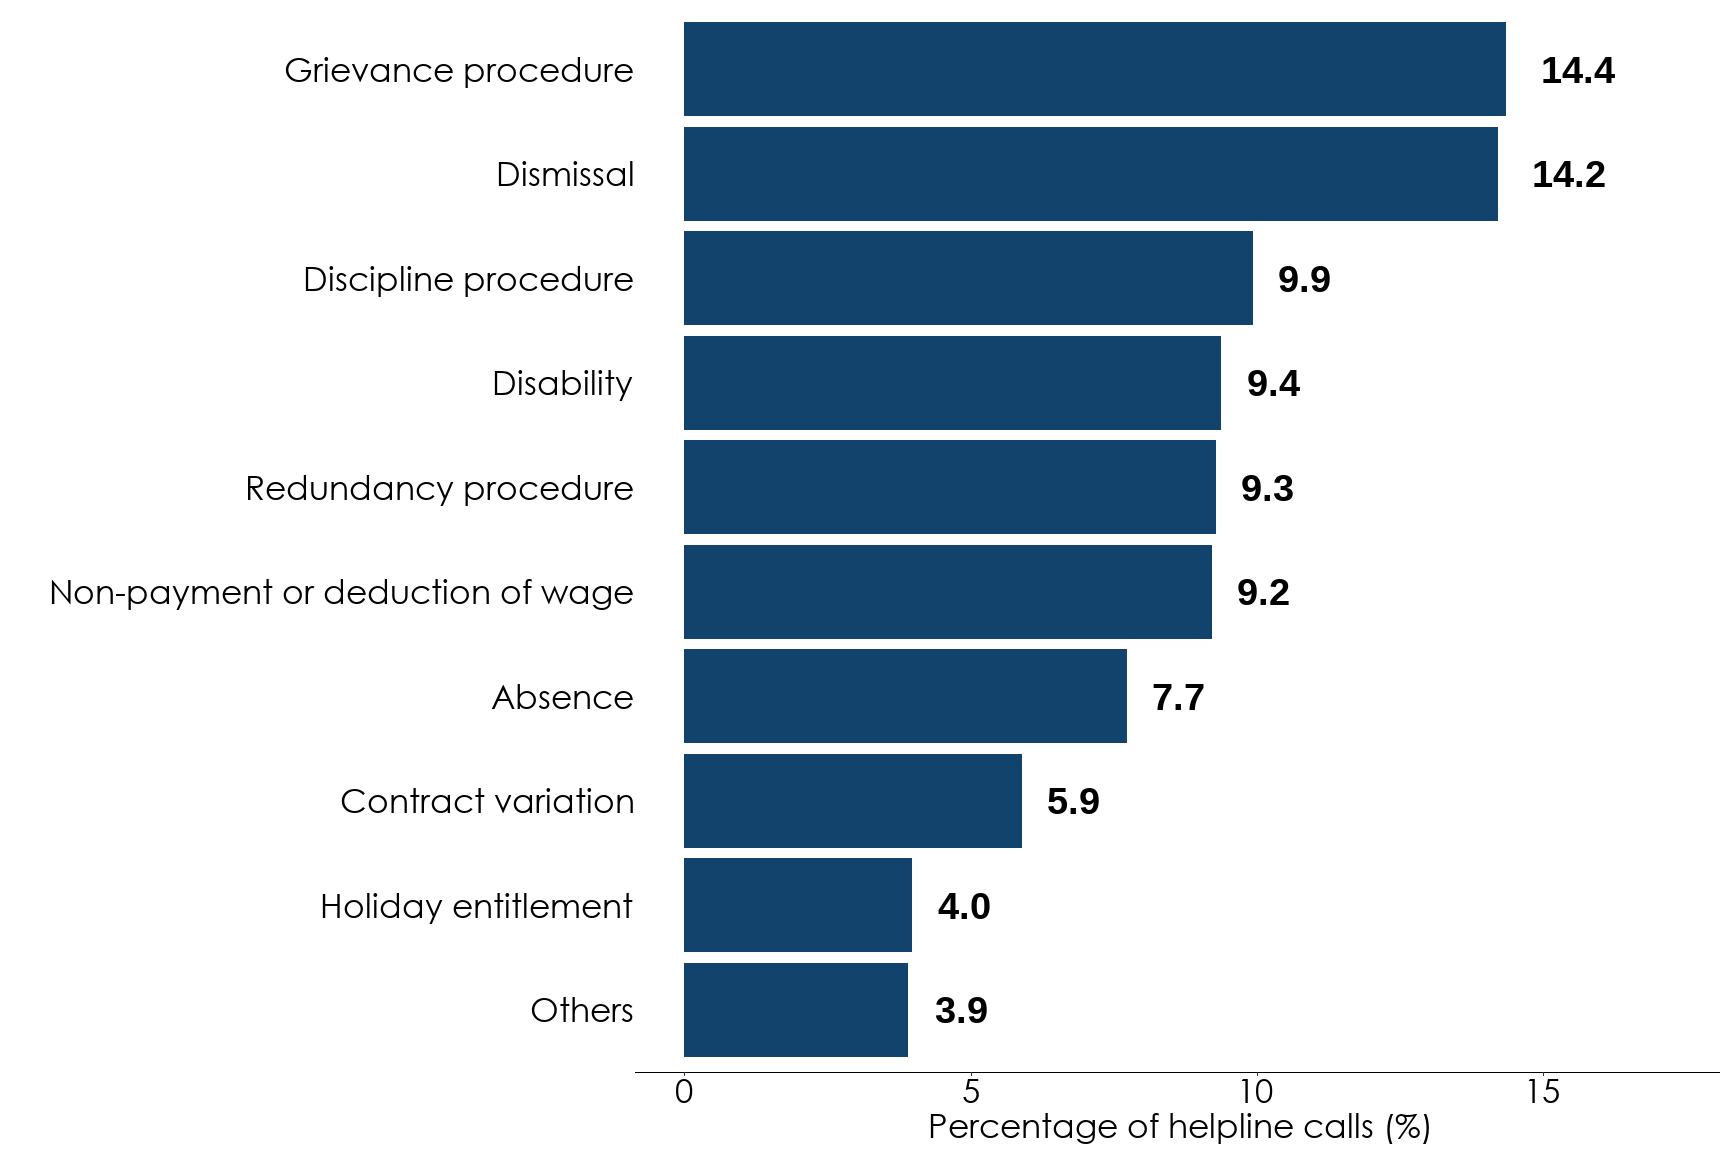
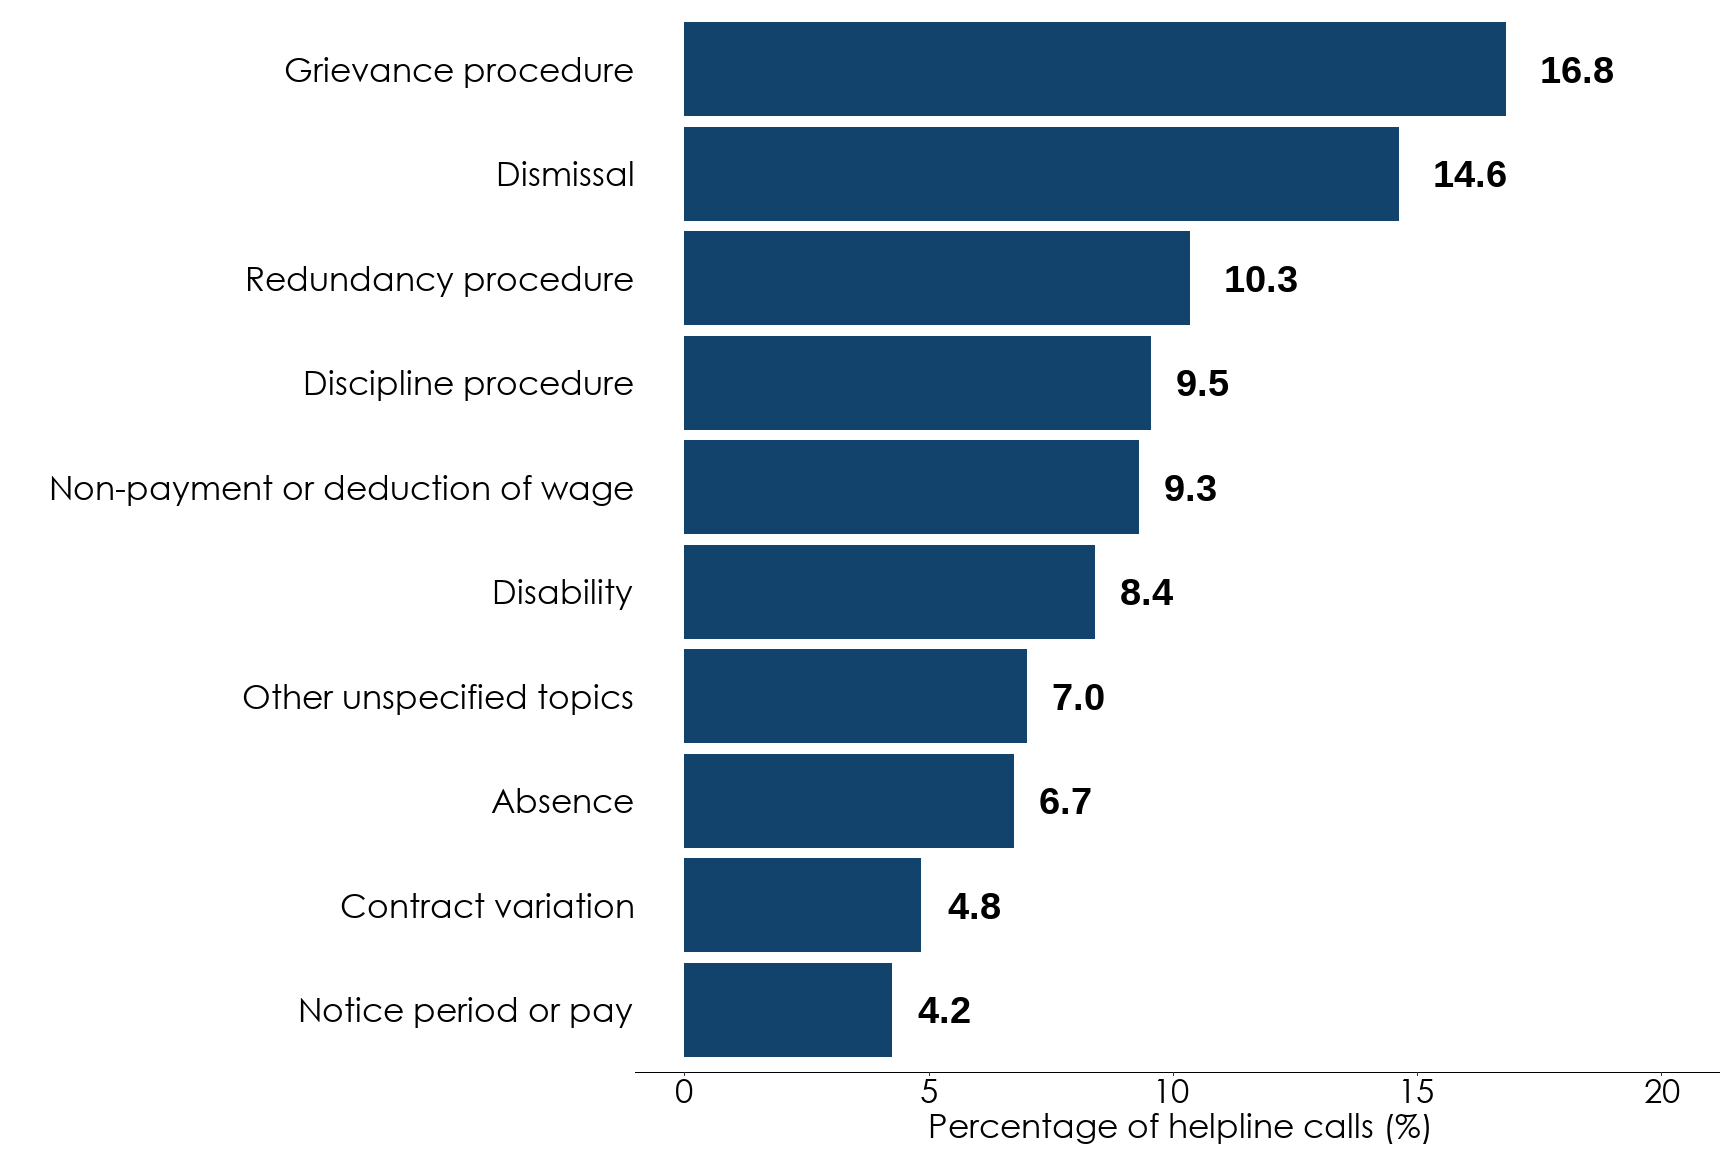
Figure 4 shows the most common subtopics this quarter. Figure 5 shows the most common subtopics last quarter. Figure 6 shows the most common subtopics in the equivalent quarter last year.
Data capture system records can be assigned up to 10 call subtopics, therefore percentages may not add up to 100%.
| Call subtopic | Percentage of helpline calls |
|---|---|
| Dismissal | 13.4% |
| Grievance procedure | 13.3% |
| Discipline procedure | 9.6% |
| Non-payment or deduction of wage | 9.2% |
| Redundancy procedure | 9.1% |
| Disability | 8.8% |
| Absence | 7.7% |
| Contract variation | 6.1% |
| Others | 4.9% |
| Bullying or harassment | 3.5% |
| Call subtopic | Percentage of helpline calls |
|---|---|
| Grievance procedure | 14.4% |
| Dismissal | 14.2% |
| Discipline procedure | 9.9% |
| Disability | 9.4% |
| Redundancy procedure | 9.3% |
| Non-payment or deduction of wage | 9.2% |
| Absence | 7.7% |
| Contract variation | 5.9% |
| Holiday entitlement | 4.0% |
| Others | 3.9% |
| Call subtopic | Percentage of helpline calls |
|---|---|
| Grievance procedure | 16.8% |
| Dismissal | 14.6% |
| Redundancy procedure | 10.3% |
| Discipline procedure | 9.5% |
| Non-payment or deduction of wage | 9.3% |
| Disability | 8.4% |
| Other unspecified topics | 7.0% |
| Absence | 6.7% |
| Contract variation | 4.8% |
| Notice period or pay | 4.2% |
4. What differences are there between workers and employers?
Workers and employers may call the Acas helpline for differing reasons. The following figures show the most common call topics and subtopics when workers call the helpline, compared with when employers call the helpline.
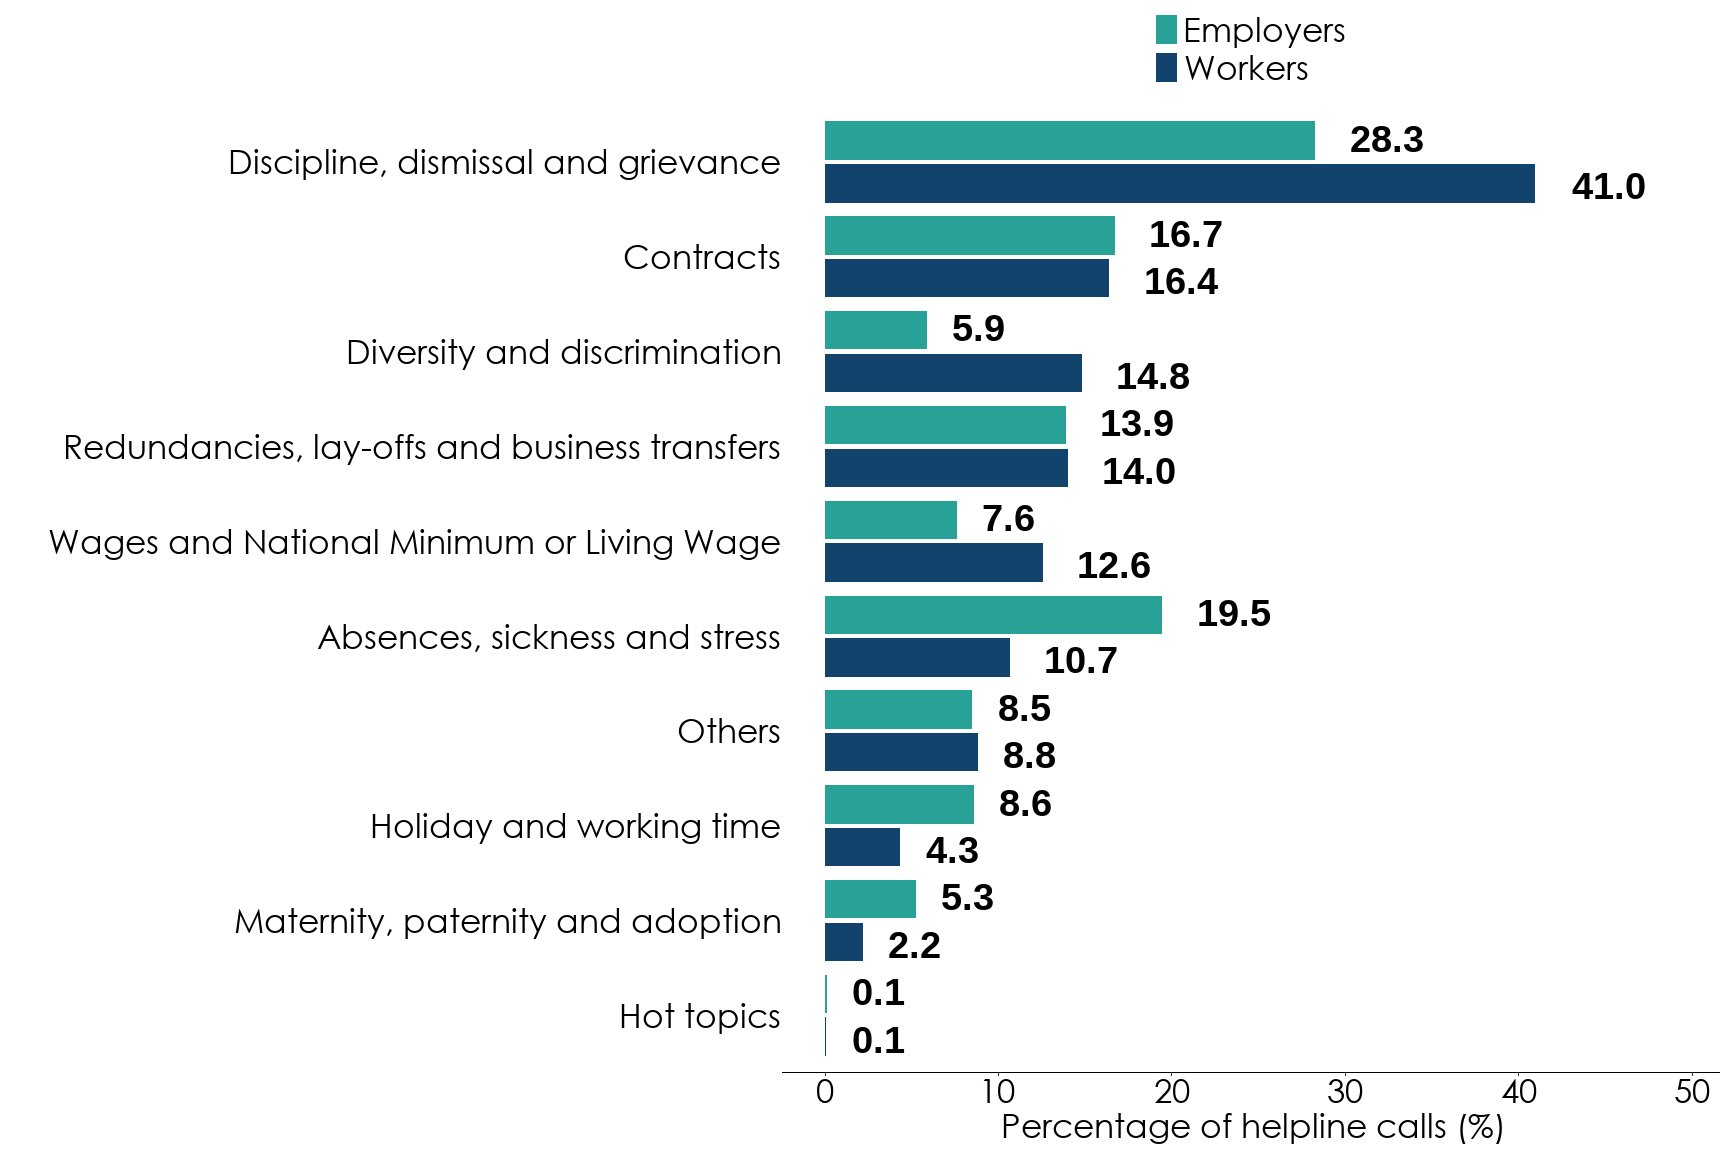
Data capture system records can be assigned up to 5 call topics, therefore percentages may not add up to 100%. The legend order reflects the order of the categories across the bars.
| Topics | Workers | Employers |
|---|---|---|
| Discipline, dismissal and grievance | 41.0% | 28.3% |
| Contracts | 16.4% | 16.7% |
| Diversity and discrimination | 14.8% | 5.9% |
| Redundancies, lay-offs and business transfers | 14.0% | 13.9% |
| Wages and National Minimum or Living Wage | 12.6% | 7.6% |
| Absences, sickness and stress | 10.7% | 19.5% |
| Others | 8.8% | 8.5% |
| Holiday and working time | 4.3% | 8.6% |
| Maternity, paternity and adoption | 2.2% | 5.3% |
| Hot topics | 0.1% | 0.1% |
Figure 7 shows that in this quarter workers were more likely to call the helpline with queries relating to:
- discipline
- dismissal and grievance
- diversity and discrimination
- wages and National Minimum or Living Wage
Employers were more likely to call the helpline with queries relating to:
- absences
- sickness and stress
- holiday and working time
- maternity, paternity and adoption
Figures 8 and 9 highlight how dismissal, discipline procedure, and redundancy procedure were amongst the common subtopics for both employees and employers in April to June 2026.
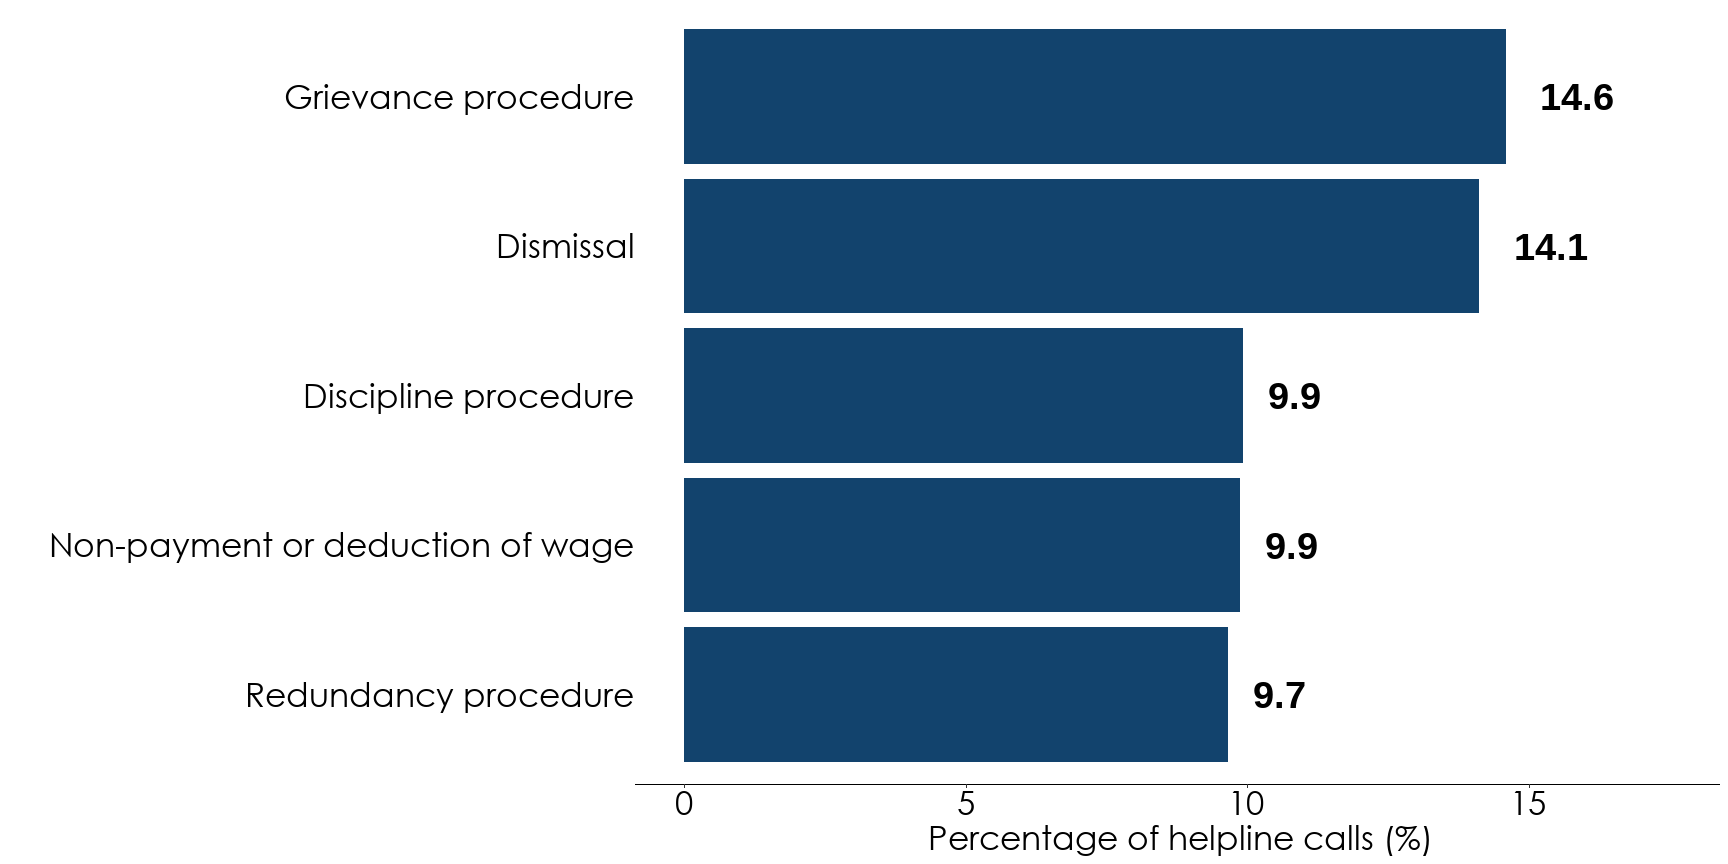
Data capture system records can be assigned up to 10 call subtopics, therefore percentages may not add up to 100%.
| Subtopic | Percentage of helpline calls |
|---|---|
| Grievance procedure | 14.60% |
| Dismissal | 14.12% |
| Discipline procedure | 9.91% |
| Non-payment or deduction of wage | 9.87% |
| Redundancy procedure | 9.65% |
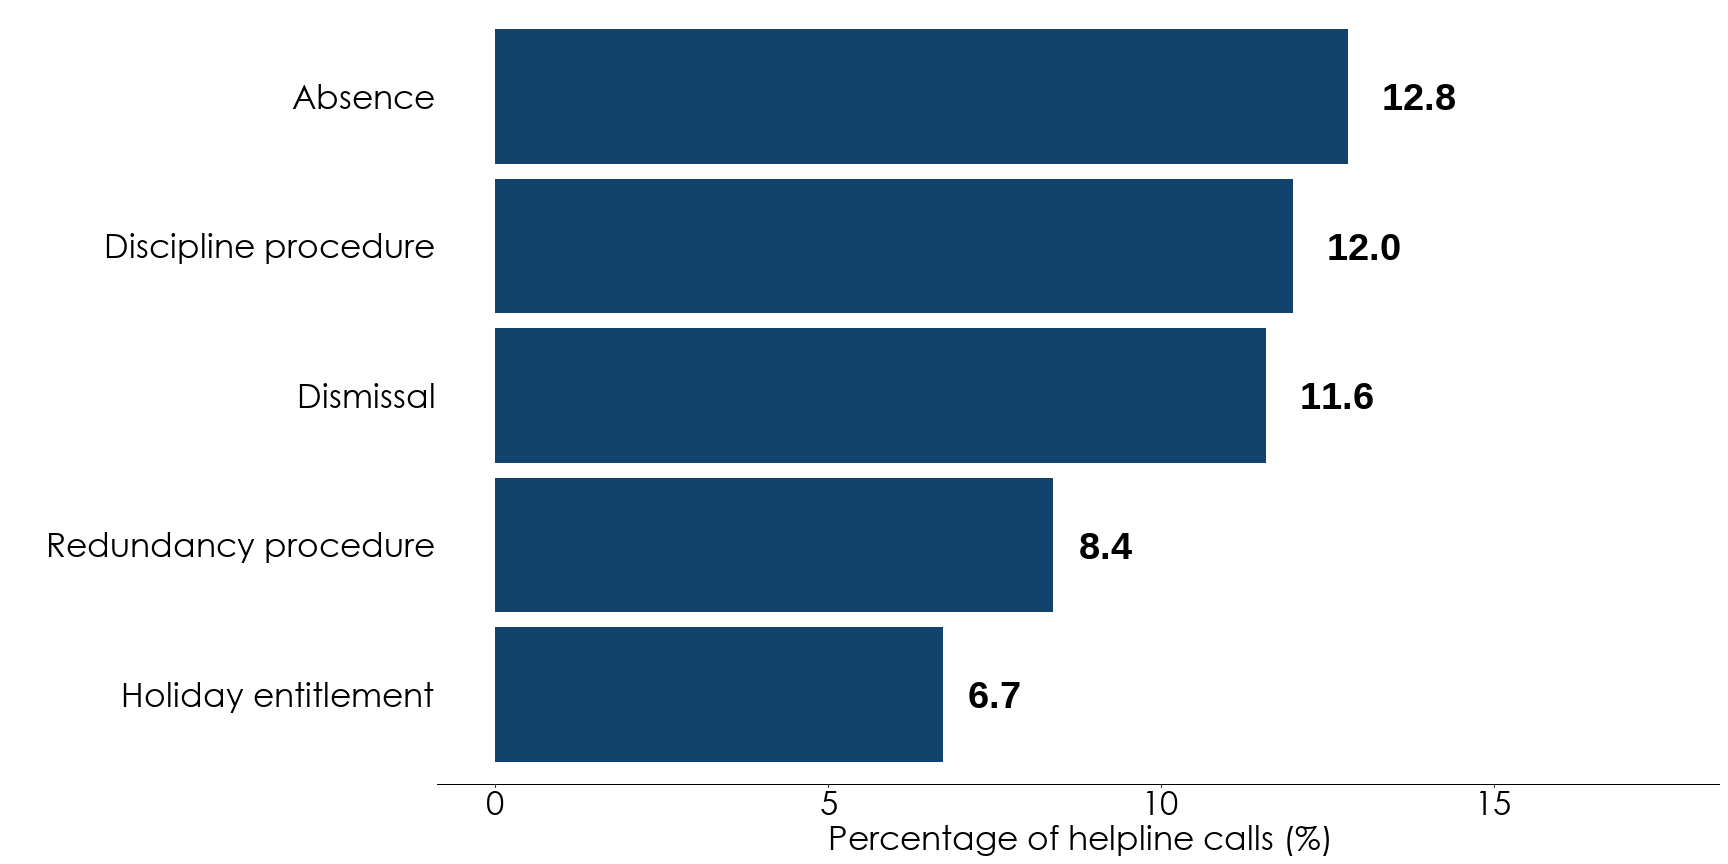
Data capture system records can be assigned up to 10 call subtopics, therefore percentages may not add up to 100%.
| Subtopic | Percentage of helpline calls |
|---|---|
| Absence | 12.8% |
| Discipline procedure | 12.0% |
| Dismissal | 11.6% |
| Redundancy procedure | 8.4% |
| Holiday entitlement | 6.7% |
5. Glossary
Call volume
The number of inbound calls answered by helpline advisers within a specified time period.
Data capture system
The helpline data capture system (DCS) is used by helpline advisers to capture information on a call such as:
- time and date of the call
- certain characteristics of a caller
- the subjects discussed during a call
- any follow-up actions from the call
Around 95% of helpline calls have associated data capture system records.
Calls from workers
Calls answered by the helpline from employees, third parties on behalf of employees, agency workers, apprentices, and interns.
Calls from employers
Calls answered by the helpline from employers, managers or third parties on behalf of employers and managers.
Call topics
High-level subjects discussed during a call. Call topics are manually assigned to a call by advisers using the data capture system. Each call can have up to 5 call topics assigned.
Call sub-topics
More specific subjects discussed during a call. Each call topic has a number of associated subtopics advisers can assign to a call. Each call can be assigned up to 10 call subtopics. A list of call topics and associated subtopics can be found in the background quality report for this data.
6. Quality
You can find more information in the background quality report 'Data quality for Acas helpline data' on:
- strengths in the data
- limitations of the data
- appropriate uses of the data
- how the data was created