Executive summary
Individual mediation is a paid-for Acas service supplying an Acas mediator to work within a company to attempt to resolve a specific disagreement, usually between 2 people, known as participants. The service is usually contracted by a commissioner, usually someone in HR or a senior leader, who arranges for Acas to provide individual mediation. There is more detail of the process and potential outcomes and impacts in the theory of change (Appendix 2).
We ask all participants and commissioners to complete a survey about their experience of individual mediation once the process is complete. This gathers feedback on the service, including whether it achieved its objectives, and areas where Acas can improve.
This report is based on data collected in those surveys during the 2025 to 2026 operational year (1 April 2025 to 31 March 2026). In total, 118 mediation participants (35% of 338 participants) and 39 mediation commissioners (20% of 192 commissioners) responded to the survey. The number and percentage of participant respondents has increased compared to previous years. The number of commissioner respondents has remained the same as last year, but fallen as a percentage of all commissioners.
Main findings
Across participants and commissioners, responses were generally positive, and very similar in 2025 to 2026 compared to 2024 to 2025.
Satisfaction
- satisfaction levels with the service were high for commissioners (88% versus 82% last year) and participants (76% versus 77%) – participants also rated the mediators highly (84% fairly or very good versus 86%)
- the large majority of commissioners said they would use mediation again (90%), the highest since 2021 to 2022
- the percentage of participants who said they would take part in mediation again, while still high (63%), has declined from 79% in 2022 to 2023
- participants most commonly had mediation at their employers' premises (58%), with satisfaction levels (75%) equal for this and video calls
Pre-mediation
- participants continue to feel that mediation took place too late – however, the percentage of issues lasting more than a year before mediation has fallen from 54% in 2024 to 2025 to 26%
- for the first time in 6 years, commissioners reported the most common step prior to mediation was a formal grievance process (56%), whereas in the previous 2 years only around a quarter had used this
Outcomes
- all commissioners (up from 92% last year) said that an objective of mediation was 'improving the working relationships between the individuals concerned'
- there is little difference in satisfaction levels between those with only a verbal agreement (75%) and those who also had a written agreement (78%) – satisfaction continues to be much lower for those with no agreement (6%)
Implications for Acas and further research
There is a clear desire amongst participants for earlier mediation. Acas should explore how future commissioners can be encouraged towards earlier intervention and involvement of Acas.
There is a slow downward trend in the percentage of participants who would take part in mediation again. Acas would benefit from exploring the reasons behind this, and what could be done to reverse it.
The survey results suggest that reaching a written agreement makes little difference to participants' satisfaction with the agreement reached, and that a verbal one is key. Acas could explore the reasons behind this and how to promote the value of a written agreement.
There has been an increase in the use of formal grievance procedures. If this trend continues, Acas should explore the reasons behind this, and whether there is a wider move towards more formal interventions.
There are some data points that suggest a shift in practice or feelings, including:
- increased formal grievance procedures prior to mediation
- slowly declining numbers of participants who would take part in mediation again
- levelling off of satisfaction levels for in-person and video mediation
Acas should continue to monitor these to assess if they represent the start of a trend or ongoing change.
1. Introduction
This report is based on data collected from surveys completed by commissioners of, and participants in, Acas individual mediations during the 2025 to 2026 operational year (1 April 2025 to 31 March 2026). Commissioners are those in the organisation who arranged for Acas to provide individual mediation, usually HR personnel or senior leaders. Participants are those who were involved in the issue needing mediation, such as employees and line managers.
In total, 118 mediation participants (35% of 338 participants) and 39 mediation commissioners (20% of 192 commissioners) responded to the survey. The number and percentage of participant respondents has increased compared to previous years. The number of commissioner respondents has remained the same as last year, but fallen as a percentage of all commissioners.
Where questions were asked of both commissioners and participants, results are reported for both groups.
Due to the relatively small number of mediations and completed surveys, findings and any comparisons to previous individual mediation evaluations should be treated with some caution. Because the base numbers for some questions are particularly low, caution is advised when interpreting the percentages due to the small numbers used in the percentage calculations. All results should be treated as indicative, as no significance tests have been conducted.
Figures and tables are used throughout the report to help the reader understand the findings. Although occasional anomalies appear due to rounding differences, these never exceed plus or minus 1%.
Across both commissioner and participant surveys, results are similar to previous years. We have only noted where there are differences compared to previous years in this report.
2. Who uses the individual mediation service?
Most (85%) of the 39 commissioners were in HR roles, an increase from around 70% in previous years. The remainder were mostly managers. Two-thirds of participants took part in mediation as employees (66%), with most of the remainder participating as managers.
The large majority of commissioners (92%) said that mediation was between 2 people. This has consistently been around 90% for the last 4 years.
Around half of the commissioners (56%) said that mediation was between an employee and their line manager. This is similar to previous years, except 2023 to 2024, when this group accounted for 67%.
Most of the remaining commissioners said mediation was between either an employee and another individual who has authority over them, or 2 individuals where there is no authority relationship.
| Parties | Number of participants | Percentage of all participants |
|---|---|---|
| An employee and their line manager | 22 | 56% |
| 2 individuals where there is no authority relationship | 8 | 21% |
| An employee and another individual who has authority over them in the organisation | 6 | 15% |
| Other | 2 | 5% |
| 2 groups of employees | 1 | 3% |
| A group of employees and another individual who has authority over them in the organisation | 0 | not applicable |
| An individual and a group where there is no authority relationship | 0 | not applicable |
| A group of employees and their line manager | 0 | not applicable |
| Total | 39 | not applicable |
Participant respondents were asked about their demographic characteristics, full details of which are in Appendix 1:
- just over half (58%) were female, similar to previous years except 2024 to 2025 when this was 78%
- the most common age groups were 45 to 54 (30%) and 55 to 64 (21%), reflecting the age of users of other Acas services such as the Acas helpline
- the majority were from a white background (78%)
- just under half were of no religion (44%), followed by Christian (37%)
- the majority were heterosexual or straight (84%)
- almost all of those who responded said their gender matched their sex at birth
- the majority spoke English as their first or main language (87%), the lowest percentage in 6 years
- over two-thirds (71%) had no long-term health condition
- of the 20 (17%) who said they have a long-term health condition, 50% said it reduced their ability to carry out activities a little, followed by 35% who said it did not reduce their ability at all
Participants (66%) and commissioners (69%) were more likely to be from large organisations (250 or more employees) than small or medium (1 to 249 employees). For commissioners, this was an increase from 58% in 2024 to 2025 – for participants, the proportion did not change.
Of those who supplied the sector of their workplace, the largest group of both participant (58%) and commissioner (54%) respondents were from public sector organisations. For commissioners, this is a shift from 2024 to 2025, when more were from the private sector (37%).
Participants mainly worked in London (17%) followed by the South West, Wales and Scotland (13 to 15% respectively).
For both participants and commissioners, the most common industry of their workplace was 'Public administration and defence including social security' – 29% of participants and 32% of commissioners. Next most common was 'Education' – 17% of participants and 22% of commissioners. This was the most common industry in 2024 to 2025.
The proportion of participants working in 'Human health and social work activities' dropped from a fifth in 2024 to 2025 to a tenth in 2025 to 2026. However, this remained the fourth most common industry. For commissioners, there was no change in this industry.
3. What is the context in which people come to individual mediation?
A third of commissioners (33%) said the issue had been going on for 6 months to a year prior to mediation, with a further third (31%) saying it had been going on for 3 to 6 months. A quarter (26%) said it had been going on for more than a year. This is a shift from previous years when the largest group of commissioners said the issues had been going on for more than a year. If this pattern continues, it may suggest a shift towards earlier mediation.
Participants reported similar figures and a similar shift. Although the largest group said the issue had been going on for a year or more (37%), this is a drop from 50% in 2024 to 2025.
About half of participants (55%) felt that mediation took place too late. Two-thirds (31%) felt it was at about the right time, and 14% said that they did not know. None thought it was too early.
More than half (59%) of all participants were allowed to make their own decision about whether to participate, for the second year running. Around a quarter (25%) were encouraged to take part but could have said no, and 16% felt pressured to take part.
Of the 16% who felt pressured to take part, most reported that most of the pressure came from their employer.
For the first time in 6 years, commissioners reported the most common step prior to mediation was a formal grievance process (56%), where formerly only around a quarter had used this. The proportion using an informal grievance process (previously the most common step) remained fairly stable at 31% (previously 34%).
Commissioners also reported an increase in formal disciplinary processes, from 3% in 2024 to 2025 to 18%. Both of these increases in formal processes may be due to a change in the question terminology, from 'meeting' to 'process'. Further data will help to confirm whether this is a shift in behaviour.
The percentage who had taken none of the listed steps fell from around 30% in previous years to 18%.
| Steps taken | Number of participants | Percentage of all participants |
|---|---|---|
| A formal grievance process | 22 | 56% |
| An informal grievance process | 12 | 31% |
| The involvement of trade union or other employee representatives | 9 | 23% |
| A formal disciplinary process | 7 | 18% |
| The final stage of a disciplinary or grievance procedure | 4 | 10% |
| An informal disciplinary process | 2 | 5% |
| An employment tribunal case | 1 | 3% |
| None of the above | 7 | 18% |
Note: respondents can select multiple steps, so the percentage total will not add up to 100.
4. How effectively is the individual mediation service being delivered?
Understanding the objectives of people who use individual mediation is key to assessing the effectiveness of the service. Two new objectives were added in 2025 to 2026:
- preventing escalation to a formal grievance
- empowering individuals to have control over the resolution process
All commissioners said that improving working relationships between the individuals concerned was an objective of mediation. Next most common was empowering individuals (44%).
| Mediation objectives | Number of participants | Percentage of all participants |
|---|---|---|
| Improving the working relationship between the individuals concerned | 39 | 100% |
| Empowering individuals to have control over the resolution process | 17 | 44% |
| Preventing escalation to a formal grievance | 12 | 31% |
| Improving the working relationships in the organisation | 11 | 28% |
| Preventing a resignation | 5 | 13% |
| Facilitating a return to work from absence | 5 | 13% |
| Preventing long term absence | 5 | 13% |
| Preventing an employment tribunal case | 4 | 10% |
| Preventing a dismissal | 1 | 3% |
Note: respondents can select multiple objectives, so the percentage total will not add up to 100.
Across all objectives, the most common response from commissioners was that it was too soon to tell whether objectives have been met (31%). This was a drop from 54% last year, despite no change in the time between completing mediation and receiving the survey. Around the same proportion (28%) said objectives had been completely met. Acas ran a randomised control trial to assess whether delaying the survey (currently sent one month after the end of mediation) would reduce the volume of commissioners saying it was too soon to tell – findings were inconclusive. Interviews with past commissioners showed there could be value in a later follow-up survey after 6 months.
Across all objectives, 18% said that an objective was not met at all. Unlike previous years, these responses were spread across most objectives.
Participants were also asked to what extent issues were resolved, with no option for 'too soon to tell'. Just over half (55%) said issues were partly resolved, with the rest evenly split between completely resolved and not at all resolved.
Two-thirds of commissioners felt that the situation had got better since mediation, up from around half in 2024 to 2025. Just over a quarter (28%) said they did not know whether the situation had changed, likely reflecting responses that it is 'too soon to tell' if objectives have been met.
From 2025 to 2026, Acas added a new question for participants, so that they were asked if they reached a verbal agreement only, a written agreement only, both or neither – previously, participants were only asked about a written agreement.
Most participants (82%) reached at least a verbal agreement, with half reaching a written agreement as well.
| Form of agreement | Number of participants | Percentage of all participants |
|---|---|---|
| Written and verbal | 59 | 50% |
| Verbal only | 43 | 36% |
| No agreement | 16 | 14% |
| Total | 118 | not applicable |
As a percentage of all participants, the number reaching a written agreement (50%) is below 2024 to 2025 (74%). However, this number varies a lot across the years, with no clear trend or direction.
Satisfaction with the outcome of mediation was highest for those with both a verbal and a written agreement (78%), though those who reached only a verbal agreement were very similar (75%). Acas's interviews with past mediation participants suggest that written agreements can be helpful as future evidence of what was agreed at mediation.
Satisfaction was lowest for those with no agreement, at 6%, with almost two-thirds of this group (62%) saying they were very dissatisfied.
5. How satisfied are users with the individual mediation service?
Overall satisfaction with the mediation service from commissioners was 88% and slightly lower for participants at 76%.
Commissioners were generally positive about the service, with an average of 88% rating it as fairly or very good. Three aspects were rated particularly highly, with 95% or more saying these were fairly or very good:
- promptness of Acas's response to contact
- understanding the issue that caused the commissioner to seek mediation
- explaining the mediation service
A new area of being clear about what information would be shared post-mediation was also rated highly, with 92% saying this was fairly or very good.
Some commissioners (15%) said that 'discussing other options' was not applicable to them, returning to similar levels as in previous years. This suggests that the increase in 2024 to 2025 was an outlier, and not the start of a pattern.
Participants were asked to rate their Acas mediator on various criteria, with an average of 84% rating the mediator as fairly or very good. 'Explaining the process of mediation' (95%) and 'explaining the role of the mediator' (96%) scored particularly highly. A new aspect of the mediator's role, 'treating the participant fairly', also scored well (88%).
'Helping to find a solution to the problem' (71%) and 'helping to understand the other person's point of view' (65%) scored lowest, but still well. Free text comments about mediators were mixed – some gave high praise, particularly around creating a space to hear each other's perspectives, while some were less positive, and felt that the mediator did not always enforce ground rules and that mediation was not helpful.
The large majority of commissioners (90%) said they would use individual mediation again, the highest since 2021 to 2022. A smaller percentage of participants (63%) said they would take part in mediation again – this is a small fall compared to most previous years, and the third year in which there has been a fall. Where participants gave reasons for not wanting to take part in mediation again, these included feeling that the mediator did not manage the interaction well, and that the problems were too entrenched for mediation to resolve.
The majority of commissioners (88%) were either fairly or very satisfied with the value for money of the mediation service.
A large majority (97%) of both commissioners and participants said they received enough information prior to mediation.
Just under two-thirds (58%) of participants took part in mediation at their employer's premises, similar to previous years except 2024 to 2025. Next most common was participation via video call (24%). Around three-quarters (77%) of participants were satisfied with the venue for mediation. Satisfaction levels were identical across the employer's premises and via video call (75%), unlike in previous years, when participants generally had higher satisfaction with the venue at their employer's premises. Where participants were dissatisfied with the venue, this was generally due to limited privacy or a preference for in-person when the mediation was via video call.
6. Conclusions
Generally, both participants and commissioners were satisfied with their experience of Acas individual mediation, and would take part in it again if the need arose. However, for participants, the number who would take part again is slowly trending down over time.
There is evidence from participants that individual mediation takes place too late in the process, with around half of participants stating this to be the case consistently over the last 6 years. However, there has been a drop in participants saying the concerns that caused the mediation had been going on for at least a year, from around 50% in previous years to 37% this year.
For the first time, the survey asked about verbal as well as written agreements. The results show that there is minimal difference in satisfaction levels between those with only a verbal agreement and those who also had a written agreement. This suggests that, although a written agreement offers an additional level of formality that may increase confidence in actions being completed, this does not appear to impact on satisfaction with outcomes.
For the first time in 6 years, satisfaction levels were equal across video mediation and mediation at the employer's premises. However, it is currently unknown if this is the start of a trend or unique to 2025 to 2026.
The 2025 to 2026 survey also showed an increase in commissioners who had used a formal grievance process prior to mediation. This may suggest a move towards more formal processes, though further data will be needed to assess if this is a trend.
Implications for Acas and further research
There is a clear desire amongst participants for earlier mediation. Acas should explore how future commissioners can be encouraged towards earlier intervention and involvement of Acas.
There is a slow downward trend in the percentage of participants who would take part in mediation again. Acas would benefit from exploring the reasons behind this, and what could be done to reverse it.
The survey results suggest that reaching a written agreement makes little difference to participants' satisfaction with the agreement reached, and a verbal one is key. Acas could explore the reasons behind this and how to promote the value of a written agreement.
There has been an increase in the use of formal grievance procedures, reflecting wider patterns of change in how conflict at work is managed. In particular, managers and HR may use more formal processes due to a lack of knowledge about or confidence in managing conflict. If this trend continues, Acas should explore the reasons behind this, and whether there is a wider move towards more formal interventions.
There are some data points that suggest a shift in practice or feelings, including:
- increased formal grievance procedures prior to mediation
- slowly declining numbers of participants who would take part in mediation again
- levelling off of satisfaction levels for in-person and video mediation
Acas should continue to monitor these to assess if they represent the start of a trend or ongoing change.
Appendix 1: Participant profile
| Gender | Number of participants | Percentage of all participants |
|---|---|---|
| Female | 69 | 58% |
| Male | 46 | 39% |
| Prefer not to say | 0 | not applicable |
| Did not answer | 3 | 3% |
| Gender identity matches sex at birth | Number of participants | Percentage of all participants |
|---|---|---|
| Female | 69 | 58% |
| Male | 46 | 39% |
| Prefer not to say | 0 | not applicable |
| Did not answer | 3 | 3% |
| Age group | Number of participants | Percentage of all participants |
|---|---|---|
| 16 to 24 | 0 | not applicable |
| 25 to 34 | 6 | 5% |
| 35 to 44 | 20 | 17% |
| 45 to 54 | 35 | 30% |
| 55 to 64 | 25 | 21% |
| 65 and over | 2 | 2% |
| Did not answer | 30 | 25% |
| Ethnicity | Number of participants | Percentage of all participants |
|---|---|---|
| White | 92 | 78% |
| Asian or Asian British | 8 | 7% |
| Black, African, Black British or Caribbean | 6 | 5% |
| Mixed or multiple ethnic groups | 3 | 3% |
| Other ethnic groups | 0 | not applicable |
| Prefer not to say | 8 | 7% |
| Did not answer | 1 | 1% |
| Religion | Number of participants | Percentage of all participants |
|---|---|---|
| No religion | 52 | 44% |
| Christian | 44 | 37% |
| Muslim | 3 | 3% |
| Hindu | 3 | 3% |
| Sikh | 2 | 2% |
| Buddhist | 1 | 1% |
| Jewish | 0 | not applicable |
| Any other religion | 0 | not applicable |
| Prefer not to say | 12 | 10% |
| Did not answer | 1 | 1% |
| Sexual orientation | Number of participants | Percentage of all participants |
|---|---|---|
| Heterosexual or straight | 99 | 84% |
| Gay or lesbian | 7 | 6% |
| Bisexual | 2 | 2% |
| Other | 0 | not applicable |
| Prefer not to say | 8 | 7% |
| Did not answer | 2 | 2% |
| English as first or main language | Number of participants | Percentage of all participants |
|---|---|---|
| English spoken as first language | 103 | 87% |
| English not spoken as first language | 7 | 6% |
| Prefer not to say | 5 | 4% |
| Did not answer | 3 | 3% |
| Physical or mental health conditions or illnesses lasting 12 months or more | Number of participants | Percentage of all participants |
|---|---|---|
| Yes | 20 | 17% |
| No | 84 | 71% |
| Do not know | 0 | not applicable |
| Prefer not to say | 11 | 9% |
| Did not answer | 3 | 3% |
| Condition reduces ability to carry out day-to-day activities | Number of participants | Percentage of all participants |
|---|---|---|
| Yes, a lot | 3 | 15% |
| Yes, a little | 10 | 50% |
| Not at all | 7 | 35% |
Appendix 2: Theory of change
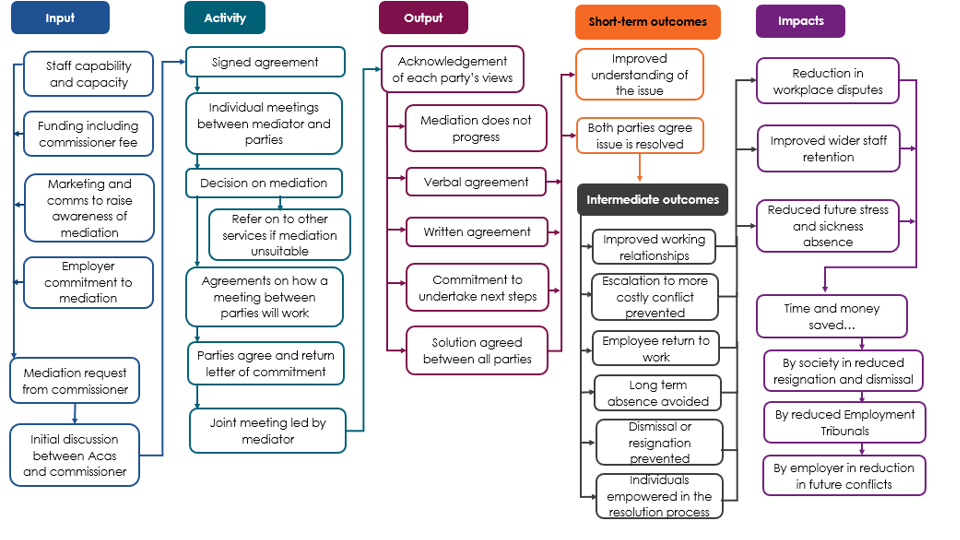
'Theory of change' text description
The 'Theory of change' model shows how different inputs and activities around mediation can lead to certain outputs. These in turn lead to short-term and intermediate outcomes, as well as wider impacts.
The process starts with 'inputs'. These are:
- staff capability and capacity
- funding including commissioner fee
- marketing and communications to raise awareness of mediation
- employer commitment to mediation
The 4 above inputs could lead to:
- a mediation request from a commissioner
This can lead to:
- an initial discussion between Acas and the commissioner
The initial discussion brings about a sequence of activities:
- Signed agreement.
- Individual meetings between mediator and parties.
- Decision on mediation.
- The decision results in either:
- a referral to other services if mediation unsuitable (no further activity)
- agreements on how a meeting between parties will work
- Parties agree and return the letter of commitment.
- Joint meeting led by a mediator.
The joint meeting could lead to the first 'output', which is an acknowledgement of each party's views.
Then one or more of the following outputs could happen:
- mediation does not progress (no further output)
- verbal agreement
- written agreement
- commitment to undertake next steps
- solution agreed between all parties leading to short-term outcomes
An agreement between all parties could lead to these short-term outcomes:
- improved understanding of the issue
- both parties agree issue is resolved
These can bring about one or more of the following intermediate outcomes:
- improved working relationships between parties
- escalation to more costly conflict prevented
- employee return to work
- long-term absence avoided
- dismissal or resignation prevented
- individuals empowered in the resolution process
These can lead to wider impacts such as:
- reduction in workplace disputes
- improved wider staff retention
- reduced future stress and sickness absence
These impacts can mean time and money saved:
- by society in reduced resignation and dismissal
- by reduced employment tribunals
- by employer in reduction in future conflicts