
Foreword
2025 marks 50 years of Acas becoming a statutory service under the Employment Protection Act 1975. It's a milestone in our long history in resolving conflicts at work from the Conciliation Act of 1896.
Acas has been a constant through the past 50 years of change in the world of work, of employment law, and of conflict at work. We continue to provide free, impartial and expert advice and practical support to employers and employees alike. Our 2025 to 2030 strategy sets out our ambitions under 3 key elements:
- prevention of conflict through healthier employment relations
- better conflict management at work by helping upskill employers
- more timely solving of conflict via early dispute resolution
One of the most significant developments in workplace relations over this period has been the falling levels of industrial action; the number of working days lost to strikes (Office for National Statistics) has fallen by 96% since a peak at 29.5 million in 1979, averaging fewer than a million days a year in the last 10 years. Over the same period, the number of employment tribunal claims (GOV.UK) has increased by 185%; from around 41,000 in 1979 to around 115,000 in 2024.
Acas research shows the annual cost of conflict in Great Britain remains too high at £28.5 billion. It does not need to be like this. We know healthy workplace relations can prevent conflict arising in the first place. If conflict cannot be prevented, it can be managed better when employees, employers and their representatives have the capabilities to 'disagree well'. And if individual or collective conflict continues, Acas will help parties resolve disputes quickly and fairly, reducing stress, duration and cost.
To reduce the costs to all parties from conflict, it is important we understand it. The findings of this report reinforce the vital need for Acas support with 2 in 5 working-age adults in Great Britain reporting experiencing conflict – the highest level of individual conflict ever reported in a survey of workers in Great Britain.
This survey brings fresh light to the causes of conflict and who is experiencing it, illustrating personal and organisational factors and industry differences. It is good to know that many people do seek informal resolution, but there are still too many who take no action in response to conflict, simply waiting for it to 'go away'. The ability to grasp and resolve conflict is a key attribute of all managers and leaders, as exemplified in our Skilled Managers programme. It is concerning to see those with a disability reporting such high levels of conflict and there is a clear call to action for everyone to build more inclusive workplaces.
This report is the first step in exploring a rich new dataset on conflict at work. We will continue to analyse the data and welcome insights and suggestions on the causes, consequences and ways forward for action in response to our findings.
Disagreements might be inevitable, but the costs and harms of conflict are not. Acas has and always will be here to help prevent, manage and resolve conflict. This report and its fresh understanding of conflict is an essential next step in the journey to Britain learning to disagree well at work.
Niall Mackenzie
Chief Executive
Executive summary
This report presents findings from the largest ever study of its kind into conflict at work in Great Britain.
The survey provides robust evidence on conflict at work experienced by people of working age – both managers and employees – in Great Britain who had undertaken work in the last 12 months.
The survey found that over two fifths (44%) of working-age adults in Great Britain experienced conflict at work in the last 12 months. Conflict was defined as disagreements, disputes or difficult relationships with a:
- work colleague
- manager or supervisor
- direct report
- customer, client or member of the public
- colleague in another organisation
It could be either an isolated incident or ongoing.
For the first time in over a decade, this survey enabled analysis of variations in levels of conflict across industries. Wholesale and retail trade workers experienced the highest prevalence of conflict (50%), with all other industries similar to or below the Great Britain average (ranging from 33% to 49%).
Experience of conflict was most common among people whose disability had a major impact on their daily life (68%).
Capability and performance issues were the most common topic of conflict (38%). People most frequently reported experiencing conflict with their line manager (32%) and colleagues in their organisation (34%).
Half of people who reported experiencing conflict stated that it was largely or fully resolved. People most commonly resolved conflict through discussion, either with their own line manager (45%) or informally with the other person (30%). This highlights the importance of informal resolution methods. Less than 10% took internal formal actions, such as formal grievances or formal capability processes – and under 0.5% filed an employment tribunal claim. Around a fifth of people took no action to deal with the conflict.
Over half of people who reported conflict (57%) experienced stress, anxiety or depression as a result. Previous Acas research estimating the cost of conflict has shown that stress, anxiety and depression have a negative effect on productivity, with an estimated annual cost of between £590 million and £2.3 billion (Saundry and Urwin, 2021).
Introduction
In July 2025, Acas commissioned the National Centre for Social Research to conduct a new survey of working-age people in Great Britain to update our understanding of conflict prevalence at work. Based on a survey previously conducted by the Chartered Institute for Personnel and Development (CIPD) as part of their Labour Market Outlook and Conflict at Work research, the scope was updated with additional questions on industry.
The survey took place over August to September 2025, and was completed by 4,558 respondents (a 50% response rate).
Where differences between groups are reported, these differences are statistically significant unless otherwise noted. This means that the differences are unlikely to be due to chance.
This report is the first step in exploring a rich new dataset on conflict at work. We will continue to analyse the data and welcome insights and suggestions on the causes, consequences and ways forward for action in response to our findings.
1. What are the levels of conflict prevalence in Great Britain?
What is the overall conflict prevalence level?
44% of people in Great Britain experienced conflict at work in the last 12 months. Previous estimates (using different methods) range from 25% to 38%. Like previous estimates, this survey included conflict at work between employees in the same organisation and with customers, clients, and colleagues in other organisations.
This is the highest level of individual conflict at work ever reported in a survey of workers in Great Britain. It highlights how widespread individual conflict is at work and the importance of supporting employers and individuals to prevent, manage and resolve it.
How does this vary by organisation size?
Conflict prevalence was higher for small and medium enterprises (SMEs), at 46%. For large organisations, it was 42%.
Breaking down these 2 high level groups into more specific organisation size bands shows similar prevalence across organisation sizes.
How does this vary by industry?
Half of wholesale and retail trade employees (50%) reported experiencing conflict at work in the last 12 months, compared to 44% of employees in Great Britain. Figure 1 shows the levels of conflict across industries.
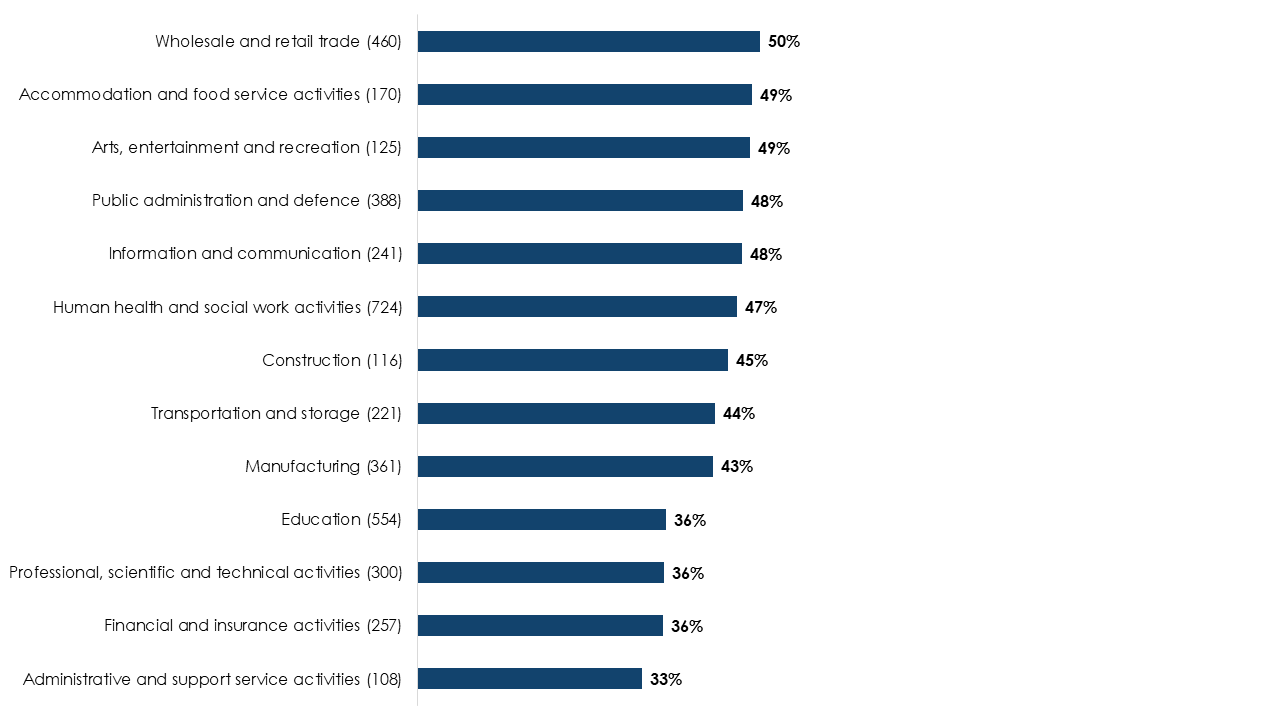
Respondent numbers are given in brackets; industries with fewer than 100 respondents, and respondents who were not matched to an industry, are excluded, so the total will not sum to 4,440.
Base: 4,440 respondents
| Industry | Percentage experiencing conflict |
|---|---|
| Wholesale and retail trade (460) | 50% |
| Accommodation and food service activities (170) | 49% |
| Arts, entertainment and recreation (125) | 49% |
| Public administration and defence (388) | 48% |
| Information and communication (241) | 48% |
| Human health and social work activities (724) | 47% |
| Construction (116) | 45% |
| Transportation and storage (221) | 44% |
| Manufacturing (361) | 43% |
| Education (554) | 36% |
| Professional, scientific and technical activities (300) | 36% |
| Financial and insurance activities (257) | 36% |
| Administrative and support service activities (108) | 33% |
Conflict was below the Great Britain average of 44% in 4 industries:
- education (36%)
- professional, scientific and technical activities (36%)
- finance and insurance (36%)
- administrative and support services (33%)
2. Who experiences conflict?
Does conflict prevalence vary by personal characteristics or location?
Conflict prevalence did not vary much between regions, with most regions having conflict levels of between 39% and 47%. However, conflict was higher in the North East, at 60%.
Conflict prevalence levels did not vary much between most age groups. However, they were lower (32%) for the 55 to 65 age group.
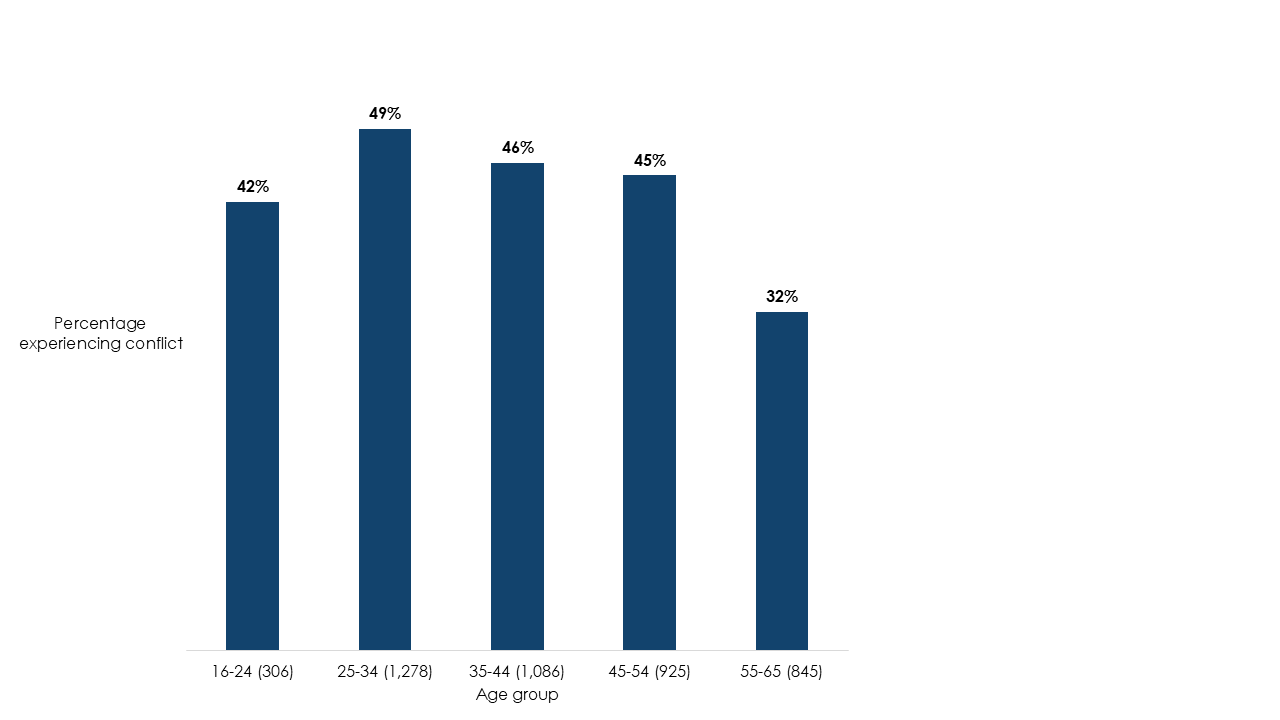
Respondent numbers are given in brackets
Base: 4,440 respondents
| Age group | Percentage experiencing conflict |
|---|---|
| 16 to 24 (306) | 42% |
| 25 to 34 (1,278) | 49% |
| 35 to 44 (1,086) | 46% |
| 45 to 54 (925) | 45% |
| 55 to 65 (845) | 32% |
There was minimal variation in conflict prevalence by gender (male: 43%; female: 45%).
Conflict prevalence was notably higher than the Great Britain average (44%) for people whose disability has a major impact on their daily life, at 68%. It was also higher for those whose disability has a minor impact on their daily life (49%) than for those with no disability, or whose disability has no impact on their daily life.
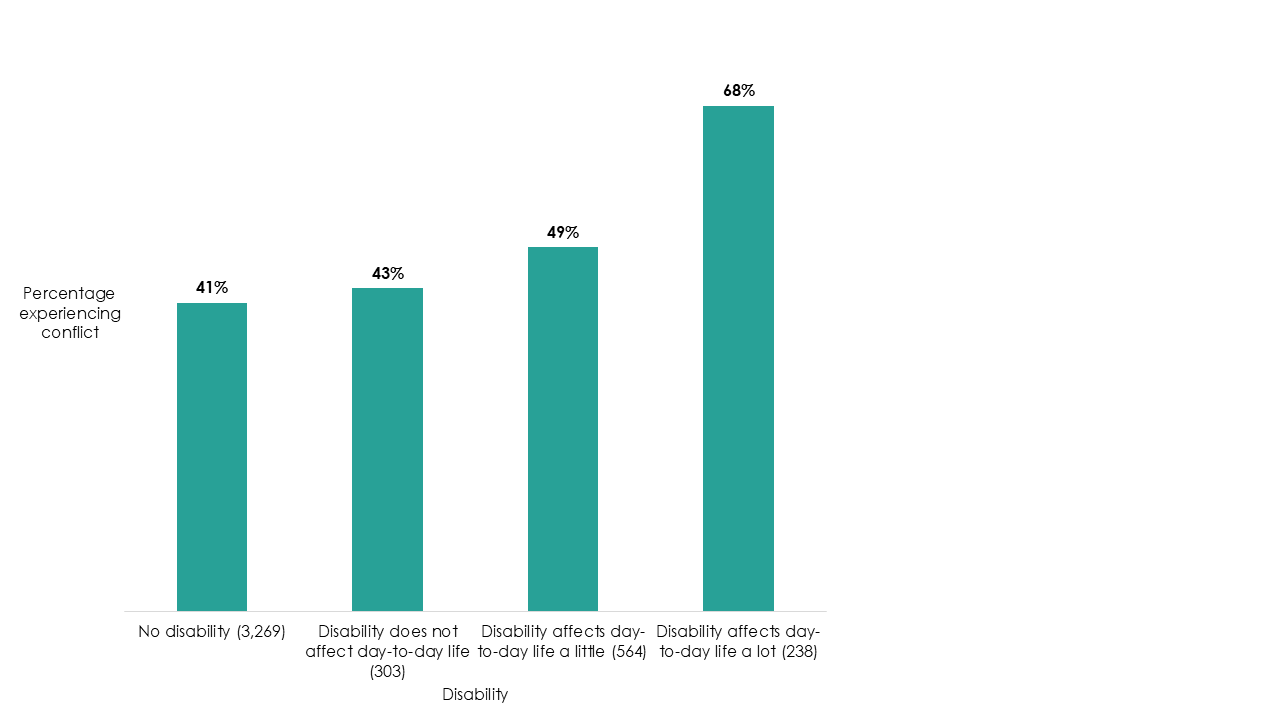
Respondent numbers are given in brackets.
Base: 4,374 respondents
| Disability | Percentage experiencing conflict |
|---|---|
| No disability (3,269) | 41% |
| Disability does not affect day-to-day life (303) | 43% |
| Disability affects day-to-day life a little (564) | 49% |
| Disability affects day-to-day life a lot (238) | 68% |
Most ethnic groups experienced similar levels of conflict. However, conflict prevalence was lower for Black or Black British people (34%) than the Great Britain average (44%).
Conflict prevalence levels were not linked to monthly reported income, or current highest level of qualifications.
3. What types of conflict do people experience, and with whom?
What are the most common topics of conflict?
The most common topic of conflict is 'capability and performance' (the person's ability to do the job), experienced by 38% of people who reported conflict.
The least common topics of conflict were 'health and safety' (8%) and 'sickness absence' (7%).
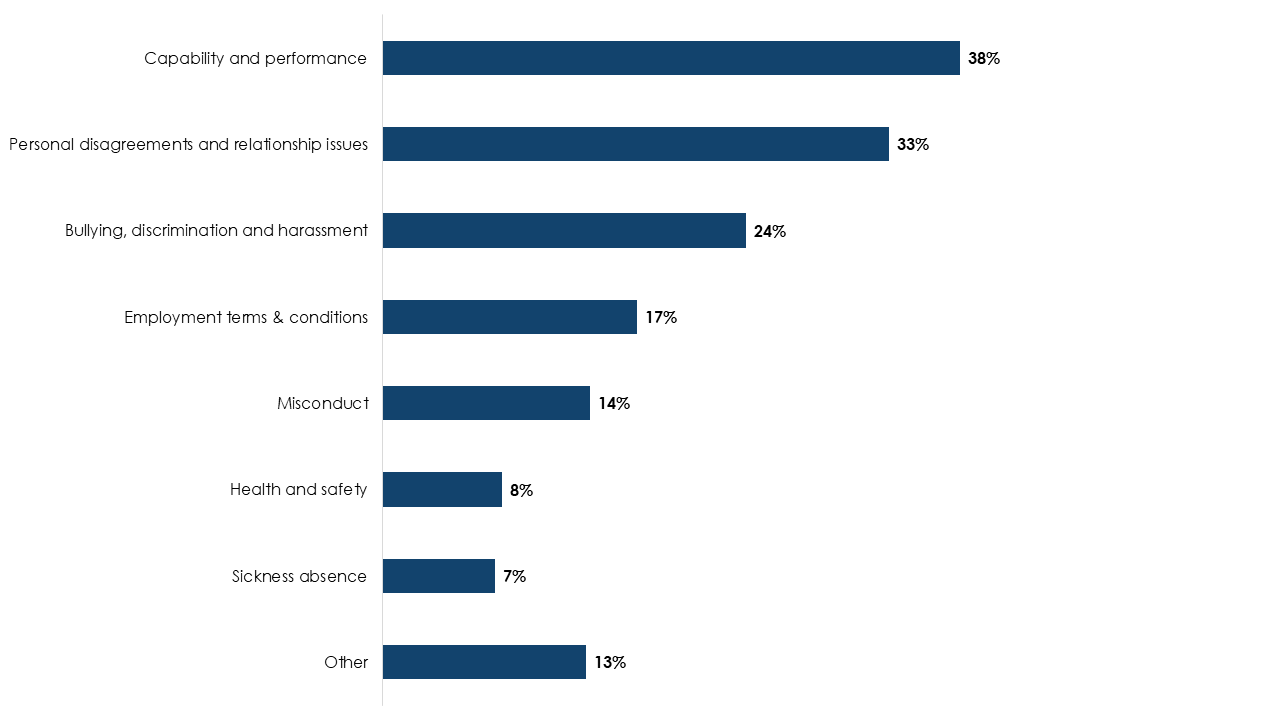
Note: Respondents could select multiple topics, so percentages will not sum to 100%.
Base: 1,943 respondents (all those experiencing conflict at work in the last 12 months)
| Topic | Percentage |
|---|---|
| Capability and performance | 38% |
| Personal disagreements and relationship issues | 33% |
| Bullying, discrimination and harassment | 24% |
| Employment terms and conditions | 17% |
| Misconduct | 14% |
| Health and safety | 8% |
| Sickness absence | 7% |
| Other | 13% |
Do topics of conflict vary between managers and staff?
Topics of conflict were similar between managers and non-managers. For both groups, the highest levels of conflict were over capability and performance (managers: 40%; non-managers: 36%), followed by personal disagreements (both 34%) and bullying, discrimination and harassment (managers: 21%; non-managers: 26%).
Among the 252 managers who had conflict with their direct reports, the most common topic was capability and performance (94%), followed by personal disagreements (80%). Bullying, discrimination and harassment was the third most common topic (44%), closely followed by misconduct (42%).
Do topics of conflict vary by personal or organisational characteristics?
As noted above, people whose disability has a major impact on their daily life reported higher levels of overall conflict (68%) than the Great Britain average (44%). They also reported higher levels of conflict than the Great Britain average in these areas:
- bullying, discrimination and harassment (40% compared to 22%)
- sickness absence (26% compared to 6%)
- employment terms and conditions (26% compared to 16%)
- misconduct (21% compared to 13%)
Previous Acas research examining the reasons for a recent rise in disability discrimination claims reaching employment tribunal found a mismatch between employers' and claimants' views of the reasons for the dispute (Acas, 2024). Employers considered poor performance or persistent absence to be the issue. Claimants, though, felt that the dispute related to their disability.
Although there was no difference in levels of conflict between men and women, men were more likely than women to report conflict over their capability and performance (men: 44%; women: 32%). Women were more likely than men to report conflict over bullying, discrimination and harassment (women: 26%; men: 21%).
Black or Black British people reported lower levels of conflict than all other ethnicity groups. 'Capability and performance' was a much less common topic of conflict for this group (18%) than for all other ethnicity groups (38%).
All age groups had similar levels of conflict (between 42% to 49%) except for those aged 55 to 65, for whom it was 32%. However, there were no significant variations between this and other age groups in topics of conflict, or when compared to the Great Britain average.
There were also no significant differences in topics of conflict by organisation size.
People working in manufacturing were less likely than the Great Britain average to report conflict over capability and performance (28% compared to 38%). People working in wholesale and retail were less likely to report personal disagreements (26% compared to 33%) but more likely to report bullying, discrimination and harassment (32% compared to 24%). People working in professional, scientific and technical activities were more likely than the Great Britain average to report personal disagreements (56% compared to 33%).
Do topics of conflict vary by location?
All regions had similar levels of conflict, except the North East, at 60%. People in most regions had highest levels of conflict over capability and performance. People in 3 regions had their highest levels of conflict over personal disagreements and relationships: East Midlands, West Midlands, and Scotland.
There were variations in topics of conflict between regions and the Great Britain average. 'Employment terms and conditions' was a less common topic of conflict for workers in Scotland and the East Midlands (10%) compared to the Great Britain average of 17%. Yorkshire and the Humber saw lower levels of conflict over capability and performance (29%) than Great Britain average (38%) although this was still the most common topic. Wales also saw lower levels of conflict over bullying, discrimination and harassment (13%) than Great Britain average (24%) or other regions.
Who do people report experiencing conflict with?
Conflict was most commonly reported being with a colleague in the organisation (39%) or the person's own line manager (32%).
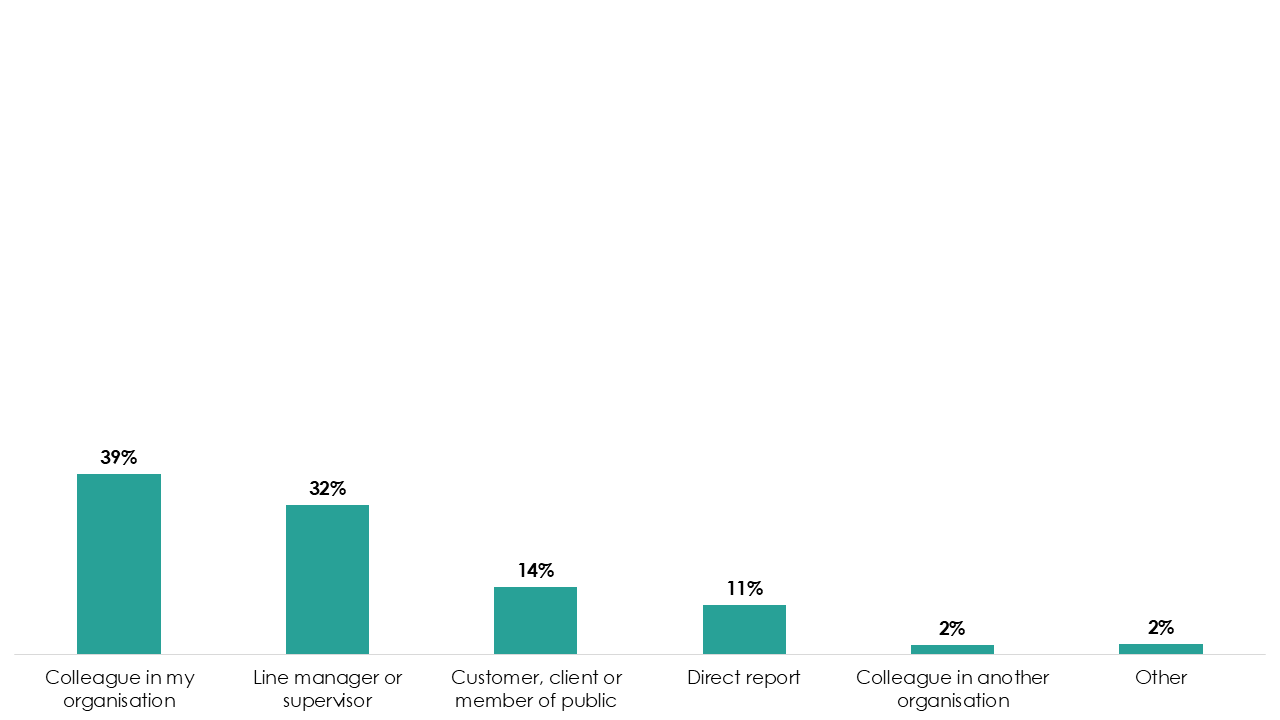
Base: 1,943 respondents (all those experiencing conflict at work in the last 12 months)
| Person | Percentage |
|---|---|
| Colleague in my organisation | 39% |
| Line manager or supervisor | 32% |
| Customer, client or member of public | 14% |
| Direct report | 11% |
| Colleague in another organisation | 2% |
| Other | 2% |
Around a quarter of workers (27%) reported experiencing conflict with multiple people in the last 12 months, and of those the most common major conflict was with their line manager (45%).
One third of managers reported conflict with their direct report (32%). This is similar to the percentage of managers reporting conflict with their own line manager (33%), and below the percentage reporting conflict with a colleague (48%).
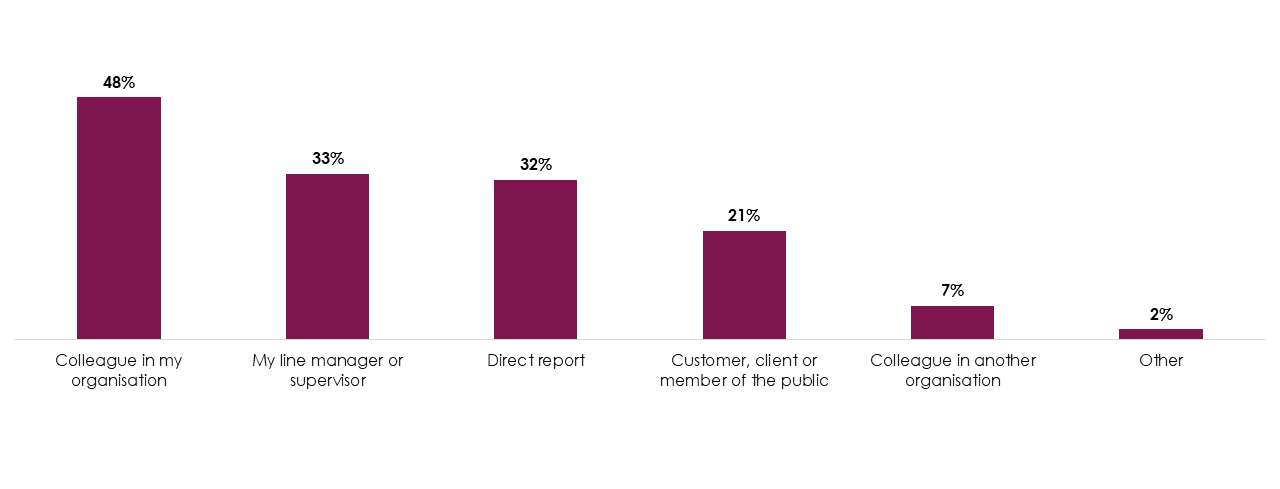
Note: Respondents could select multiple causes, so percentages will not sum to 100%.
Base: 800 respondents
| Person | Percentage |
|---|---|
| Colleague in my organisation | 48% |
| My line manager | 33% |
| Direct report | 32% |
| Customer, client or member of the public | 21% |
| Colleague in another organisation | 7% |
| Other | 2% |
Do personal or organisational characteristics affect who people report experiencing conflict with?
People in the 55 to 65 age group reported the lowest levels of conflict across all age groups (32%). They were more likely than all other age groups to report conflict with a colleague (31% compared to 25% across all other age groups).
Black or Black British people also reported lower levels of conflict than all other ethnicity groups (34%). They were less likely than all other ethnicity groups to report conflict with a direct report (3%; all other ethnicity groups: 11%). This may be because Black or Black British people who reported experiencing conflict were less likely than all people in Great Britain who reported conflict to be managers (16% compared to 41%). All other ethnicity groups who reported experiencing conflict were made up of around 35% to 48% managers.
Men were more likely than women to report conflict with a colleague (41%; women: 36%) or their direct report (12%; women: 9%). Women were more likely to report experiencing conflict with their line manager (35%; men: 29%). This is despite men being more likely than women to report conflict over capability and performance. When looking only at conflict with line managers, no one topic was particularly common for women. For men, however, 'capability and performance' was more common than other topics (47%; next most common 33%).
There were higher reported levels of conflict between disabled people and their line managers (38%) compared to people without a disability (29%). In contrast, disabled people were less likely than non-disabled people to report conflict with colleagues (36%; non-disabled: 41%) or with direct reports (9%: non-disabled: 12%).
There were higher levels of conflict in small and medium enterprises (46%) than large organisations (42%). People working in small and medium enterprises were more likely (17%) than those in large organisations (11%) to report experiencing conflict with customers, clients or members of the public.
The people who were involved in reported conflict were fairly similar across industries. People in the following industries were more likely than the Great Britain average to report conflict with colleagues:
- information and communications
- professional, scientific and technical activities
4. How do people resolve conflict?
What actions do people take to resolve conflict?
People mainly reported using informal methods to try to resolve conflict. The most common action people took to resolve conflict was a discussion with their own manager (45%), followed by an informal discussion with the other person involved in the conflict (30%).
Around a fifth (19%) did not take any action. This was more common among people who said the conflict had no impact on them (32%) than those who said it had some form of impact (16%). People working in small and medium enterprises were also more likely to take no action (23%) than those working in large organisations (15%).
The most common formal method used to resolve conflict was a formal grievance or complaint (9%). Very few people (under 0.5%) tried to resolve the conflict by filing an employment tribunal claim.
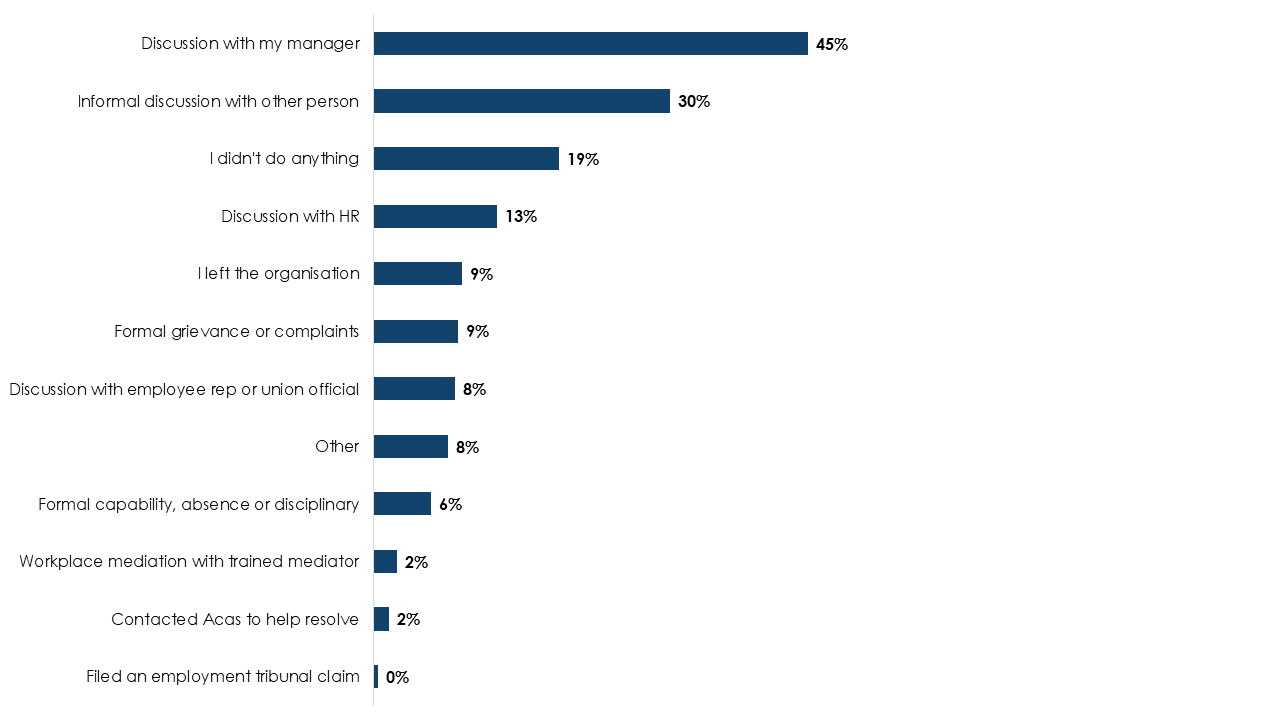
Note: Respondents could select multiple causes, so percentages will not sum to 100%.
Base: 1,943 respondents (all those experiencing conflict at work in the last 12 months)
| Action | Percentage |
|---|---|
| Discussion with my manager | 45% |
| Informal discussion with other person | 30% |
| I didn't do anything | 19% |
| Discussion with HR | 13% |
| I left the organisation | 9% |
| Formal grievance or complaints | 9% |
| Discussion with employee rep or union official | 8% |
| Other | 8% |
| Formal capability, absence or disciplinary | 6% |
| Workplace mediation with trained mediator | 2% |
| Contacted Acas to help resolve | 2% |
| Filed an employment tribunal claim | 0% |
Half of people reporting conflict said their conflict was largely or fully resolved. At the other end of the spectrum, a third of people reporting conflict said it was mainly or completely not resolved (31%). Figure 8 shows the full breakdown of how completely conflicts were resolved.
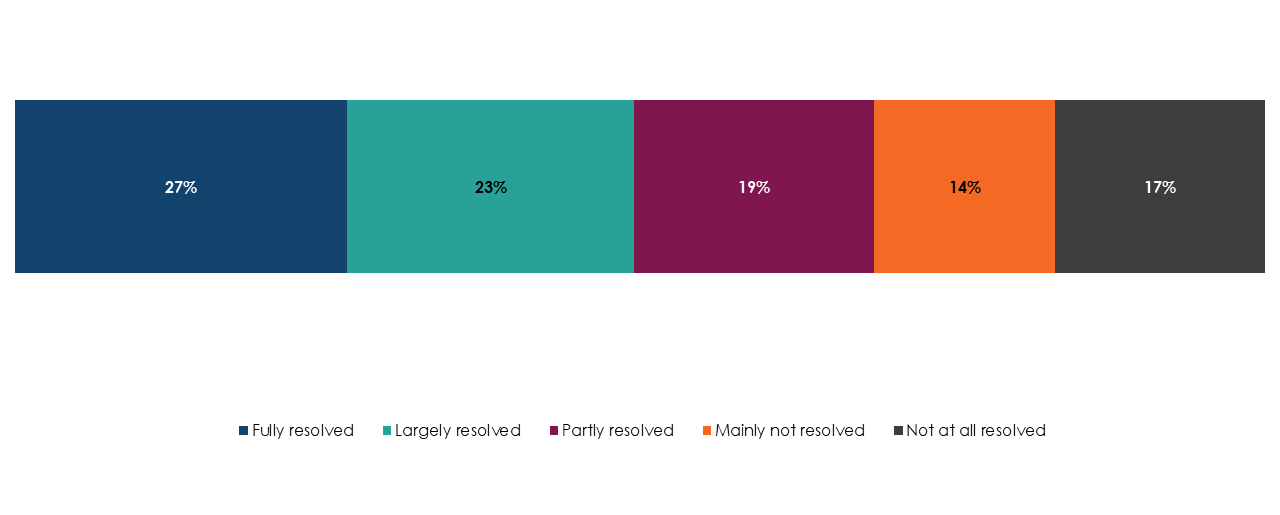
Base: 1,943 respondents (all those experiencing conflict at work in the last 12 months)
| Resolution | Percentage |
|---|---|
| Fully resolved | 27% |
| Largely resolved | 23% |
| Partly resolved | 19% |
| Mainly not resolved | 14% |
| Not at all resolved | 17% |
Which action do people think is most important in resolving conflict?
Once broken down by categories, small numbers for most actions make it difficult to comment on what was most important in resolving the conflict. Where larger numbers of people took a particular action, around half (52%) of 591 people who used informal discussion with the other person to resolve the conflict felt that it was most important in resolving the conflict.
Do actions and their importance in resolving conflict vary between managers and non-managers?
Managers and non-managers were both most likely to take 1 of 2 actions to resolve conflict:
- discussion with their own manager (53% of managers, 41% of non-managers)
- informal discussion with the other person involved in the conflict (41% of managers, 27% of non-managers)
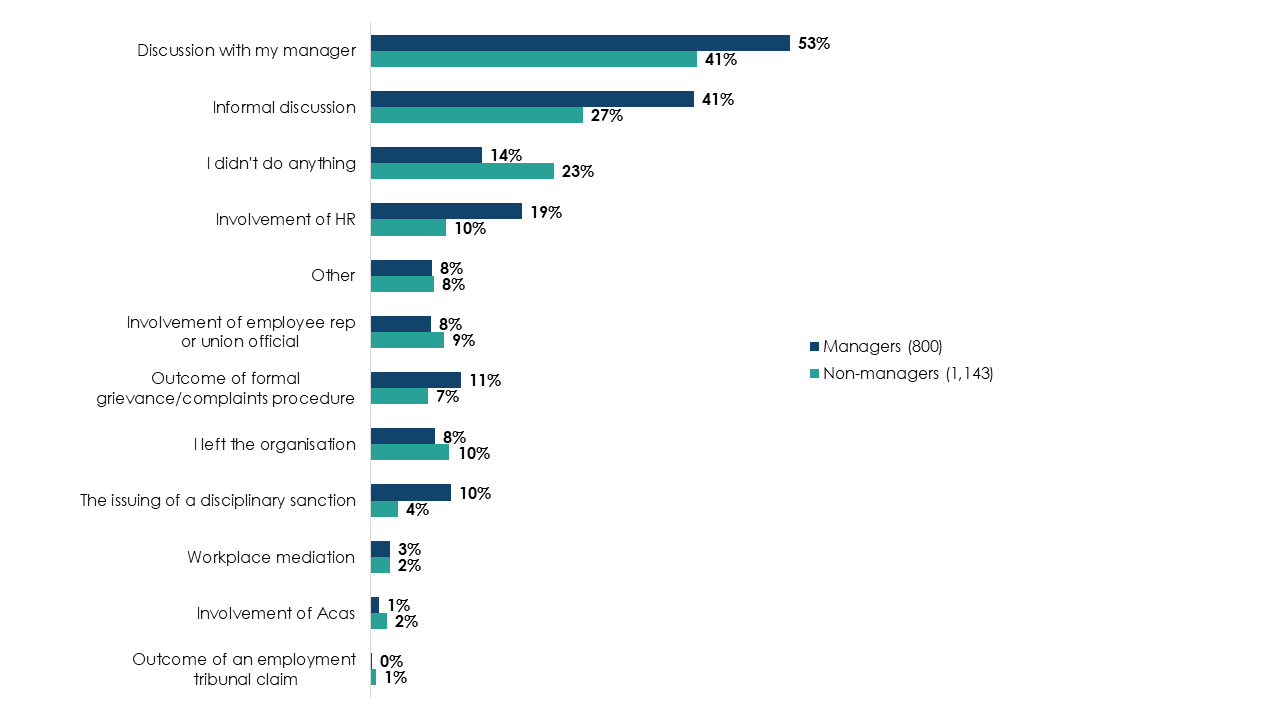
Base: 1,943 respondents (all those experiencing conflict at work in the last 12 months)
| Action | Managers (800) | Non-managers (1,143) |
|---|---|---|
| Discussion with my manager | 53% | 41% |
| Informal discussion | 41% | 27% |
| I didn't do anything | 14% | 23% |
| Involvement of HR | 19% | 10% |
| Other | 8% | 8% |
| Involvement of employee rep or union official | 8% | 9% |
| Outcome of formal grievance or complaints procedure | 11% | 7% |
Due to small numbers, it is difficult to say whether views on the importance of different actions varied between managers and non-managers.
In almost all instances where managers reported conflict with a direct report (252 in total), the manager tried to resolve this through informal discussion (98%). Around half (49%) involved HR. In both cases, this was higher than for all managers and non-managers who experienced conflict, regardless of who it was with.
A third of managers reported doing nothing in response to conflict with a direct report (35%). This is higher than both all workers in conflict with anyone (19%) and managers experiencing conflict with anyone else (14%). This echoes findings of previous Acas research into managing conflict at work, that showed managers' low confidence in dealing with conflict can lead to lack of action on their part to resolve conflict (Saundry et al, 2024).
5. What is the impact of conflict?
What is the impact of conflict on people experiencing it?
The most common reported impact of conflict was stress, anxiety or depression (57%), followed by a drop in motivation or commitment (49%).
This is consistent with a backdrop of high levels of long-term sickness absence caused by depression and anxiety among the working-age population. Office for National Statistics data shows that economic inactivity due to long term sickness is at record levels (over 2.5 million, or 31% of all economically inactive people), with estimates in 2023 suggesting more than half of this is attributable to depression or anxiety (53%).
17% of people who reported conflict said it had no impact on them.
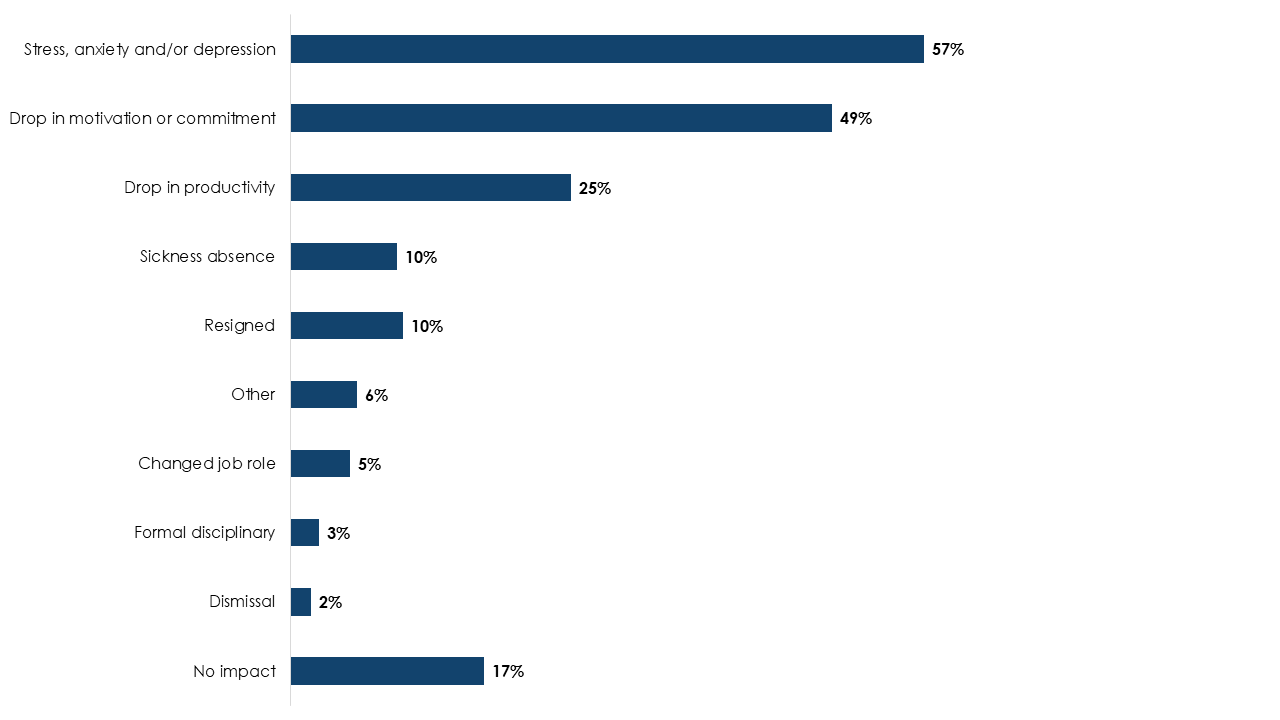
Note: Respondents could select multiple impacts, so percentages will not sum to 100%.
Base: 1,943 respondents (all those experiencing conflict at work in the last 12 months)
| Impact | Percentage |
|---|---|
| Stress, anxiety and/or depression | 57% |
| Drop in motivation or commitment | 49% |
| Drop in productivity | 25% |
| Sickness absence | 10% |
| Resigned | 10% |
| Other | 6% |
| Changed job role | 5% |
| Formal disciplinary | 3% |
| Dismissal | 2% |
| No impact | 17% |
How much time do managers spend on conflict?
Just over half of managers reported spending a week or less on managing their main or sole conflict (55%) over the previous 12-month period. Of these, 57% spent a day or less on it.
7% spent more than 1 month in a 12-month period managing conflict.
6. Conclusions
Over two fifths of people in Great Britain reported experiencing conflict at work in the last 12 months. Although it is difficult to compare this result with other sources due to different methods and respondent groups, this survey shows the highest level of individual workplace conflict ever reported in a survey of Great Britain workers. It highlights the prevalence of individual conflict at work and the importance of supporting employers and individuals to prevent, manage and resolve this.
Most conflict does not result in formalised processes, such as internal discipline and grievance procedures or claims to an employment tribunal. However, there is some evidence that formalised responses to conflict have increased. For example, the number of early conciliation notifications to Acas shows some evidence of increasing: there were around 125,000 notifications in 2024 to 2025, the second highest rate in the last 10 years. Read Acas's annual report on GOV.UK (Acas, 2025).
Acas's previous research into disability discrimination claims found that a key influence on people's choices throughout the process was a decline in their health or ongoing stress (Acas, 2024). This most recent survey shows that stress, anxiety or depression is the most common impact of conflict on all those experiencing it. In a wider context, it is well-documented that economic inactivity due to long-term sickness is at record levels and estimates from 2023 suggest more than half of it is attributable to depression or anxiety.
Most conflicts at work are resolved through informal means such as discussions with managers. In some cases (less than 10%) this required more formal interventions, such as formal grievances or capability processes.
Our previous research into the cost of conflict shows that more formal processes are more costly in both time and money for organisations, including wider impacts such as stress, wellbeing, absence and presenteeism for those involved (Saundry and Urwin, 2021). These costs also increase as conflict escalates to and through formal procedures.
Although very few of the reported conflicts in this research progressed to employment tribunal claims, the progression of cases to tribunal can be similarly costly in time, money and stress for employees and employers. Acas's annual report shows that the early conciliation service is important in preventing these cases from progressing all the way to tribunal, with 69% of cases resolved through early conciliation instead of progressing to tribunal in 2024 (Acas, 2024).
At the other end of the scale, a notable minority of people experiencing conflict took no action in response to it; this included managers experiencing conflict with a direct report. Although this sometimes succeeded in resolving conflicts, wider Acas research shows it is not always an effective response to conflict as unaddressed issues can remain latent and resurface.
Acas's research shows that giving managers the confidence to intervene earlier and proactively resolve conflict is important. This helps create healthy employment relationships and more productive workplaces where conflict is either prevented or identified early and managed effectively (Saundry et al, 2024). This is a key element of Acas's strategic goal to help workplaces more effectively prevent, manage and resolve conflict.
Acas continues to play a vital role in the prevention, management and resolution of conflict. Our 2025 to 2030 strategy details how we will continue to do so for the next 5 years.
There is more work to do in understanding this new dataset and its implications. In particular, we need to understand:
- how to prevent and resolve conflict experienced by people with a disability that significantly affects their daily life
- why Black and Black British people experience lower levels of conflict
- how and why topics of conflict vary amongst different groups, including gender, industry and geographical region
We are encouraged by the widespread use of informal methods to resolve conflict and wish to promote further use of these techniques explored in our recent research into defining and enabling informal workplace conflict resolution. We will continue to explore these topics through further analysis and use the insight from this report to inform our policy, guidance and services.
We will also, in 2026, use these updated figures on conflict prevalence to publish an update to our 2021 cost of conflict report.
Reference list
Acas, (2025), 'Acas annual report and accounts, 2024 to 2025'
Acas, (2024), 'Characteristics and drivers of disability discrimination employment tribunal claims'
Ministry of Justice (2025) 'Tribunal Statistics Quarterly: January to March 2025'
Office for National Statistics (2025) 'INAC01 SA: Economic inactivity by reason (seasonally adjusted)'
Office for National Statistics (2025) 'Labour disputes; working days lost due to strike action; UK (thousands)'
Office for National Statistics (2023) 'Rising ill-health and economic activity because of long-term sickness, UK: 2019 to 2023'
Saundry, R, Saundry, F, Urwin, P, Bowyer, A, Mason, S, Kameshwara, K and Latreille, P, (2024), 'Managing conflict at work – policy, procedure and informal resolution'
Saundry, R and Urwin, P (2021), 'Estimating the costs of workplace conflict'
Urwin, P, Saundry, R, Saundry, F, Kameshwara, K, Bowyer, A and Latreille, P (2024), 'Managerial capability and staff engagement − findings from the Skilled Managers Productive Workplaces research programme'
Technical Annex
Sampling approach and response volumes
Participants were drawn from the NatCen Opinion Panel. Its members are recruited through probability-based surveys using the Postcode Address File (PAF) as the sampling frame. Participants are selected at random, and substantial effort is made to secure interviews to ensure high quality, representative data.
Specifically, Panel participants are drawn from four surveys:
- British Social Attitudes (BSA), from 2015 onwards
- Scottish Social Attitudes (SSA), from 2015 onwards
- Consumer Protection Study (CPS), conducted in 2021
- Life in Northern Ireland, conducted in 2023
For this survey, all panel members aged 16 to 65 recruited from BSA 2015 onward and Life in Northern Ireland – who had not subsequently left the panel or become 'inactive' – were eligible to be invited. From this pool, a random sub-sample of 12,650 cases was selected, maintaining the probability-based design.
Selection probabilities were adjusted by sampling in proportion to weights reflecting the extent to which the panel members characteristics listed below were over- or under- represented in the eligible panel. The procedure enhances the representativeness of the issued sample as much as possible.
Panel member characteristics adjusted by sampling in proportion to weights:
- age
- sex
- region
- household structure
- income
- education
- economic activity
- ethnicity
- tenure
- social class
- interest in politics
- party support
Panellists selected were contacted at multiple times, and via multiple modes to provide them with the required information and encourage them to take part in the live survey. Multiple modes of contact (letter, email and SMS), diverse messages (social impact, reward upon completion, urgency etc) and different days of the week were used to maximise the chances of reaching different groups.
The fieldwork period lasted for one month, from 22 August to 21 September 2025.
To improve sample quality, fieldwork resources were redirected from individuals who are typically over-represented in the sample and participate regularly, towards those who are under-represented and participate less frequently.
Potential survey respondents were invited to complete an initial screener to determine if they were currently in employment or had been employed in the last 12 months. Those who had not were screened out.
Remaining respondents were then asked initial questions about whether they had experienced conflict in their main or only job, and for details of the employer (industry, organisation size). Those who had not experienced conflict were then screened out.
Respondents who had experienced conflict then proceeded to the full survey. Managers were asked some additional questions.
The volumes and response rates for each stage of the survey process are shown in Table 11.
| Stage | Number | Percentage |
|---|---|---|
| Invited to survey | 12,649 | Not applicable |
| Completed screener | 6,261 | 50% |
| Of which completed initial questions | 4,556 | 73% |
| Of which completed full survey (experienced conflict) | 1,943 | 44% |
Note: due to weighting applied to those who completed the initial sections of the survey, numbers will not add up at every stage.
To account for non-response at the points of: recruitment survey, invitation to join the panel (at the end of the recruitment interview), drop out from the panel, and the survey itself, some weighting was applied. In addition to weighting of recruitment surveys, weights were computed to adjust for non-response at the subsequent stages producing the final survey weight.
For respondents who completed the initial questions or the full survey, further data already collected by the contractor and updated for this survey was used in analysis. The variables are:
- sex or gender
- age category (grouped)
- highest educational qualification achieved
- class identity
- tenure (grouped)
- main economic activity (grouped)
- National Statistics Socio-Economic Classification (NS-SEC) analytic class
- subjective income
- household income (2021) (grouped)
- household income – equivalised (2021) (grouped)
- number of people in household (grouped)
- household type
- relationship status (grouped)
- whether respondent has any children (0 to 18) in the household
- urban/rural indicator 2011 (England and Wales) (grouped)
- urban/rural indicator 2011 (Scotland) (grouped)
- urban/rural indicator 2011 (Northern Ireland) (grouped)
- government office region
- political party identification (grouped)
- ethnic group (grouped)
- frequency of internet use (grouped)
- disability status
Not all variables were used for analysis or included in this report.
If you would like to see the full survey, you can contact research@acas.org.uk.